HashKey Capital Monthly Insights Report: June 2024
 HASHKEY CAPITAL
Reading Time: 9.93Min
HASHKEY CAPITAL
Reading Time: 9.93Min
TL;DR
June’s crypto market cap declined by 7% due to negative news and lack of catalysts.
TVL growth adjusted to token price was positive, growing by 6.7%, outpacing the market cap decline.
Wallet activity increased for Bitcoin (+26%) and Ethereum (+34%), and Bitcoiners owning ≥1 BTC surpassed 1 million.
L2 and L3 activity significantly increased in June.
Bitcoin traded between $60k support and $64k resistance level.
Futures market trades in contango, indicating traders’ anticipation of a future price increase.
Despite a decrease in CEX volume, DEX volume had its best month in three months.
June 2024 HIGHLIGHTS
VanEck filed for a Solana spot ETF with the SEC
1 million BTC wholesalers milestone reached
zkSync airdropped its token ZK, making it one of the biggest airdrops ever. Blast and IO.NET also completed their airdrops
Unconfirmed reports declared that Michael Dell has bought Bitcoin
Mt. Gox announced starting repaying its creditors a total of 950,000 BTC
Cardano announced integration with the IBC protocol, allowing Cardano projects to bridge between Cardano and Cosmos
SEC developments make Ethereum approval closer
Deutsche Telekom, the largest telecommunications company in Europe, has announced its plans to begin mining Bitcoin
Crypto startup VC fundraising just hit the $100 billion milestone
ICBC, one of the world’s largest banks, compared Bitcoin to gold
Robinhood announced acquiring the crypto exchange Bitstamp
Introduction — Crypto Market Overview — June 2024
In June 2024, the total crypto market capitalization experienced a 7% decline, primarily influenced by news such as the Mt. Gox Bitcoin distribution to creditors and the absence of significant market catalysts. Despite this, the month also presented several positive indicators for the crypto market.
The Total Value Locked (TVL) adjusted for token price grew by 6.7%. This growth in TVL suggests a strengthening of the underlying fundamentals of the crypto market.
Wallet activity saw a notable increase for both Bitcoin and Ethereum, with a growth of 26% and 34%, respectively. Additionally, Layer 2 and Layer 3 activity saw significant growth in June, demonstrating the expanding use cases and scalability solutions in the crypto ecosystem.
Bitcoin ended the month trading between the $60k support and the $64k resistance level, maintaining a relatively stable price range. The futures market traded in contango, with a premium indicating a bullish sentiment among traders anticipating a future price increase.
In regulatory developments, VanEck filed for a Solana spot ETF with the SEC, marking a significant step towards expanding the availability of cryptocurrency investment products.
Overall, while the crypto market experienced a decline in June, the month also presented several positive developments and indicators of growth, suggesting a resilient and evolving crypto ecosystem.
Crypto Market Capitalization
June was a weak month for crypto in general, with the total crypto market cap declining by 7%, from 2.45 Trillion to 2.28 Trillion. Bitcoin’s dominance ended the month 0.3% higher than the previous month, at 53.3%.
In part, the June price decline can be explained by expectations of Bitcoin sales coming from Mt. Gox distributions in July.
So far, June was the worst month of the year, with the crypto market cap correcting -12% and the Bitcoin price declining by 11%, while the stock market rose 2.8%.
Compared to May, June was a more uneventful month lacking catalysts to excite investors.
65.5% of all Bitcoin hasn’t moved in over one year.
TVL Growth Adjusted to Token Price
TVL — Total Value Locked — is an important indicator of the healthiness of on-chain activity.
The chart below shows the TVL adjusted by native token for different chains. This allows us to track the TVL growth normalized by the price appreciation, isolating how much the TVL comes from net new inflows rather than price appreciation.
In June, the TVL growth outpaced the total market cap growth by 6.7%, indicating that users are deploying more into DeFi.
This is the breakdown of the TVL adjusted by native token price for the chains analyzed:
Arbitrum: +40%
Polygon: +11%
Total TVL/Crypto Mcap: +6.8%
TON: 2.1%
Avalanche: -1.7%
Ethereum: -1.7%
Bitcoin: -4%
BNB: -7.7%
Solana: -7.7%
Tron: -17.6%
Active Addresses
Although price-wise, June was a negative month for crypto in general, and also for Bitcoin and Ethereum prices, both Bitcoin and Ethereum saw an increase in wallet activity, with each growing by 26% and 34% in June, respectively.
Wallet activity is seen as a leading indicator. The number of active wallets takes us to Metcalfe’s Law, which measures a network’s value. The law shows that the value of a network grows exponentially as the number of its users increases.
While the market experienced a downturn in June, the increase in wallet activity for both Bitcoin and Ethereum suggests a growing interest and potential for future growth.
At the same time, as report by IntoTheBlock, the number of Bitcoin Wholecoiners (i.e. users with at least one Bitcoin) surpassed the one million milestone on the last week of June.
On-chain Fees and L2 Activity
Despite the price declines across the board in June, the fees collected by most L1s and L2s were at similar levels compared to the previous months.
Ethereum was the biggest winner in terms of fees, generating $142 million, while the top L2 was Arbitrum, generating a $4.3 million cash flow.
June was, in fact, a very positive month for on-chain activity. This can be confirmed by the chart below from L2Beat. In fact, the number of transactions on L2 and L3 chains doubled in June.
Ethereum Supply Variation
Ethereum has been inflationary for the last three months, with June being the most inflationary month since the Merge upgrade happened in September 2022. This happened despite the fact that Ethereum active addresses grew by 34% in June.
A good explanation for this change in the inflation rate is the fact that since the Dencun upgrade on March 13th, Layer 2s pay significantly lower fees to the Ethereum chain, thus generating a lower burn rate on Ethereum (see Proto-Danksharding). The lower fees, on the other hand, significantly improve the user experience, which is good to bring and retain users on the Ethereum ecosystem.
June Leaders and Laggards
Bitcoin returned -7% in June, dragging down altcoins too. Typically, altcoins have oversized reaction to the Bitcoin price and as a result, out of the top 100 coins by market cap, only 9 had positive returns.
Among the top 100 market cap crypto assets, the best performers in June are:
Brett: 77%
Mog Coin: 46%
Kaspa: 32%
Toncoin: 22%
ENS: 19.5%
Notcoin: 19%
Among the top 100 market cap crypto assets, the worst performers in June are:
Chiliz: -47.00%
Beam: -42.00%
Celestia: -41.00%
Starknet: -40.00%
Ethena: -39.00%
Gala: -35.00%
Price Trends and Technical Analysis
Bitcoin moved sideways for the entirety of Q2 2024, ranging most time between $60.000 and $70.000.
Bitcoin ended the month at the $63.000 mark after testing the $60.000 resistance level during the last week of June.
Currently, the support/resistance levels are:
$51k — $52k
$59k — $60k
$63k — $64k
$67 — $68k
$71 — $73k
The technical oscillators show that the market is indecisive regarding which direction it should take. There are no strong overbought or oversold indicators, with most of the indicators show a neutral market situation.
Bollinger bands: Neutral.
RSI: Neutral
CCI: Neutral
MACD: Oversold
From the levels illustrated in the charts above, we can expect either a sideways market or a small uptrend during July, depending on the market catalysts for the next month.
Futures Market in Contango
The Bitcoin futures market has been trading in contango during June, meaning that the price of Bitcoin futures contracts has been higher than the spot price of Bitcoin. This market premium can be seen as a bullish sign, indicating that investors are willing to pay a premium for the opportunity to buy Bitcoin at a future date.
The chart above corresponds to CME’s Sept. 24 Bitcoin futures price minus spot Bitcoin price.
Throughout most of June, the chart shows positive values, meaning that the September 2024 Bitcoin futures price was consistently higher than the spot price. Investors were willing to pay a premium to secure a futures contract, possibly anticipating a price increase in the future.
Bitcoin Hashrate
The Bitcoin hashrate took a hit in June, dropping to the lowest level of the quarter. This can be seen as a normal situation as the Bitcoin halving last April 19 cut the mining rewards by half, and in May, the Bitcoin hashrate still hit a new all-time high.
This, combined with a decline in the Bitcoin price and paired with a decline in mining fees, turns Bitcoin mining unprofitable for some miners who consequently decide to shut down their mining equipment. While in May, the average amount of transaction fees collected by miners was $7 million per day, in June, the amount dropped to approximately $3.5 million. This might be related to lower activity on Bitcoin L2s and Bitcoin Runes.
Spot Volumes
After the strong growth of spot volumes in March, the volume on centralized exchanges has declined for three consecutive months. June’s spot volume was $1.11 trillion, less than half of the $2.49 trillion registered in March. The slowdown in trading volume might be justified by the fact that the last 2 months were uneventful and lacked triggers for crypto traders.
Despite the above chart, it’s important to highlight that the spot volumes do not behave the same in the entire market. DEX volumes (chart below) have, in fact, grown, with June being the best month in the quarter at $162 billion in volume.
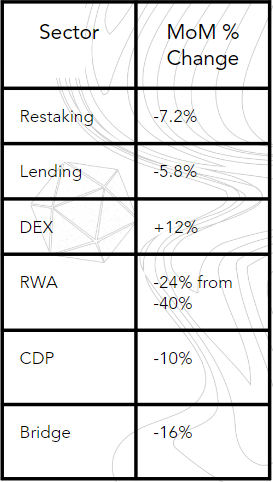
DeFi Activity
In June, the chains that won the most in terms of TVL were Linea and TON. These chains now occupy the 11th and 12th place in terms of TVL ranking.
The top chains in terms of TVL can be seen in the chart below.
DEX activity, as we saw previously, was higher in June, and the DEX TVL grew by 12%.
However, other than DEXes, all the other DeFi sectors TVL have dropped in June. The biggest loser was the RWA sector, declining by 24% after the 40% decline on May.
DISCLAIMER
This material is for general information only, and does not constitute, nor should it be interpreted as, any form of research output, professional advice, solicitation, offer, recommendation, or trading strategy.
No guarantee, representation, warranty or undertaking, express or implied, is made as to the fairness, accuracy, timeliness, completeness or correctness of any general financial and market information, analysis, and/or opinions provided on this report, and no liability or responsibility is accepted by HashKey Capital in relation to the use of or reliance on any such information. Any information on this report subject to change without notice. This report has not been reviewed by the Securities and Futures Commission of Hong Kong, the Monetary Authority of Singapore or any regulatory authority in Hong Kong or Singapore.
Please be aware that digital assets, including cryptocurrencies, are highly volatile and subject to market risks. The value of digital assets can fluctuate significantly, and there is no guarantee of profit or preservation of capital. You should carefully consider your own risk tolerance and financial situation before making any decision.
Distribution of this report may be restricted in certain jurisdictions. This material does not constitute the distribution of any information or the making of any offer or solicitation by in any jurisdiction in which such action is not authorised or to any person to whom it is unlawful to distribute such a report.