HashKey Capital Monthly Insights Report: July 2024
 HASHKEY CAPITAL
Reading Time: 12.07Min
TL;DR
Crypto Market cap reached a 3-month low of $1.9 trillion on July 5th and recovered to $2.2 trillion by month-end.
Bitcoin and Ethereum showed an inverse correlation with US stocks
TVL growth outpaced total market cap growth by 8.9%, indicating strong net new inflows.
Bitcoin US ETF AUM increased by 12.6% to $58 billion and the Ethereum spot ETFs saw significant outflows due to Grayscale ETHE conversion.
Post-Dencun upgrade, Ethereum's inflation rate is 1.08%/year, impacting supply/demand dynamics.
Hashrate increased by 12% in July, indicating miner recovery post-halving.
Crypto continues to see further institutional adoption.
July 2024 Highlights
Mt. Gox paid Bitcoin and Bitcoin Cash compensations to 70% of its creditors
Asset managers file for Solana spot ETF with the SEC.
Bitcoin ETFs gained traction, with the Blackrock Bitcoin ETF IBIT leading with multiple days of inflows of over $100 million.
US inflation numbers reveal a 3% inflation.
Presidential candidate Donald Trump’s assassination attempt.
Larry Fink, CEO of BlackRock, expressed his belief that Bitcoin is a legitimate financial asset.
US spot Ethereum ETFs go live.
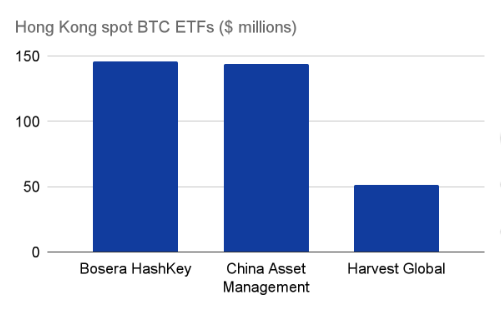
The HashKey Bosera Bitcoin ETF has become the top BTC ETF in Hong Kong.
At the Bitcoin Conference 2024, Donald Trump revealed plans to create a US Government strategic national Bitcoin stockpile and the US Senator Cynthia Lummis argued that having Bitcoin as a reserve asset would help strengthen the U.S. dollar.
Michael Saylor updated his Bitcoin price prediction to $13 million by 2045.
Introduction - Crypto Market Overview - July 2024
In July, the total crypto market cap reached a three-month low of $1.9 trillion on July 5th but recovered to end the month at $2.2 trillion. While Bitcoin gained 1.5% and the S&P 500 gained 1%, the correlation between Bitcoin and US stocks turned inverse, suggesting Bitcoin's potential as a hedge against economic uncertainties.
Bitcoin demonstrated superior risk-adjusted returns compared to the S&P 500, driven by a 27% gain from its lowest to highest price points within the month. Total Value Locked (TVL) growth outpaced total market cap growth by 8.9%, indicating strong net new inflows into various blockchain ecosystems. Notably, Avalanche and Arbitrum led with TVL growth of 33% and 23%, respectively.
The US Bitcoin ETFs saw a 12.6% increase in assets under management (AUM), reaching $58 billion, while Ethereum spot ETFs, despite initial outflows due to Grayscale ETHE conversion, marked a significant milestone for the industry.
Among the top 100 coins, 29 ended the month in the green, with Mantra, Helium, and XRP being the top performers, while Chiliz, Beam, and Celestia were the worst performers. Bitcoin tested the $67k - $68k resistance level and showed potential for a breakout depending on August market catalysts. Technical indicators suggest a neutral to slightly bearish short-term outlook. Post-Dencun upgrade, Ethereum's inflation rate stands at 1.08% per year, impacting supply-demand dynamics. Active addresses on the main Ethereum network dropped as Layer 2 solutions gained traction, while the Bitcoin hashrate increased by 12% in July, indicating miner recovery post-halving.
Trading activity surged with Bitcoin's daily average spot volume at $11 billion, up 13% month over month, and Ethereum at $7.2 billion, up 41%.
Crypto Market Capitalization in July
In June, the crypto total market cap reached a 3-month low of $1.9 trillion on July 5th. After that, the market recovered, ending the month 16% higher at a $2.2 trillion market cap.
Part of the market low was due to the Mt. Gox distributions to creditors and selling pressure from the German government of approximately 44,200 BTC.

Despite the positive recovery in July, the crypto market started at the same level it ended the previous month: $2.2 trillion.
From the start to the end of the month, the total crypto market declined by 0.1%, Bitcoin gained 1.5% and the S&P 500 gained 1%.
Important to note that from the lowest price point of the month to the highest, Bitcoin gained 27%, and the total crypto market 23.5%. On the other hand, the S&P 500 moved only 2.2% from its July lowest point to the highest.
Falling Correlation Between Crypto and US Equities
Over the last two months, the crypto markets lost correlation with the US stock market. While in the long term both the stock market and crypto are highly correlated to the liquidity in the market (M2 supply), in the short term, the markets can often be uncorrelated.
Currently, the correlation coefficient of Bitcoin and US stocks is -0.21 while Ethereum is -0.53 (see chart below). This means that last month they were inversely correlated.
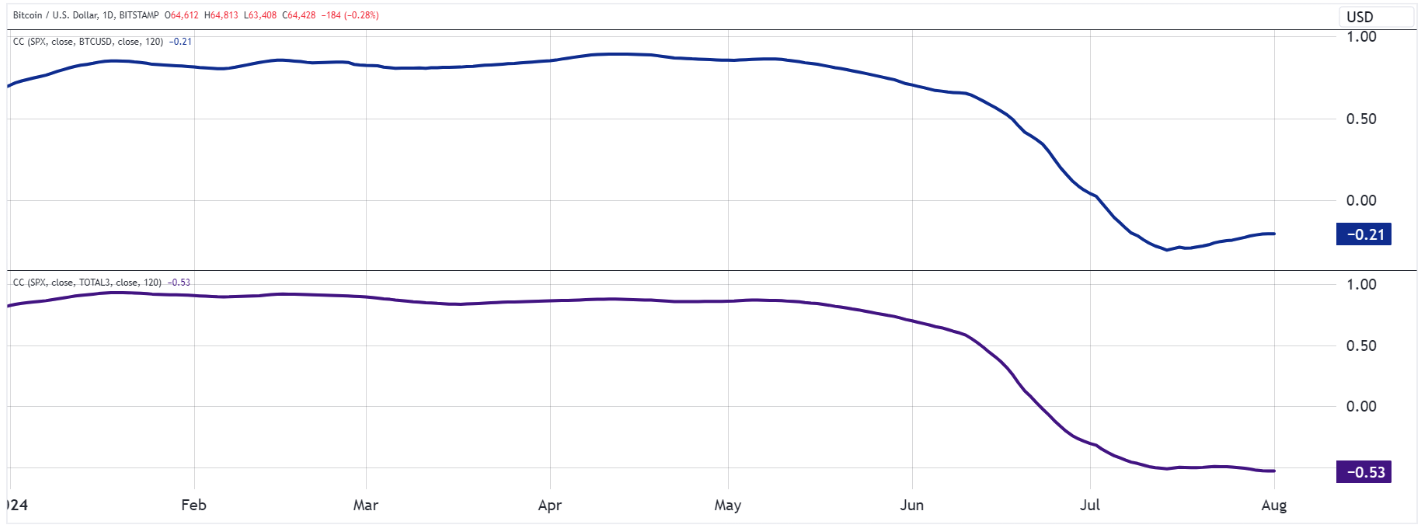
Current issues such as the U.S. debt crisis ($34.8 trillion debt with a debt to GDP ratio of 123%, which is a 59% increase in 5 years), economic recession, inflation, and global isolationism could all serve as opportunities for Bitcoin's rise. Bitcoin's role as a "dollar reservoir," a non-banking system asset, and the most liquid global asset gives it special historical value.
Politicians and US presidential candidates such as Donald Trump and Robert F. Kennedy Jr. have included Bitcoin in their candidacy narrative, including promising not to sell the Bitcoin currently owned by the US (210,000 BTC) and building a Bitcoin strategic national reserve.
Bitcoin Risk-Adjusted Returns
Bitcoin has gained only 1.5% on the month, it has shows better risk adjusted returns than the stock market.
Historically, Bitcoin has shown better risk-adjusted returns compared to the S&P 500 in different time horizons.
In July, the S&P 500 Sortino ratio (which measures risk-adjusted returns), was -0.51, while Bitcoin was 2.46.
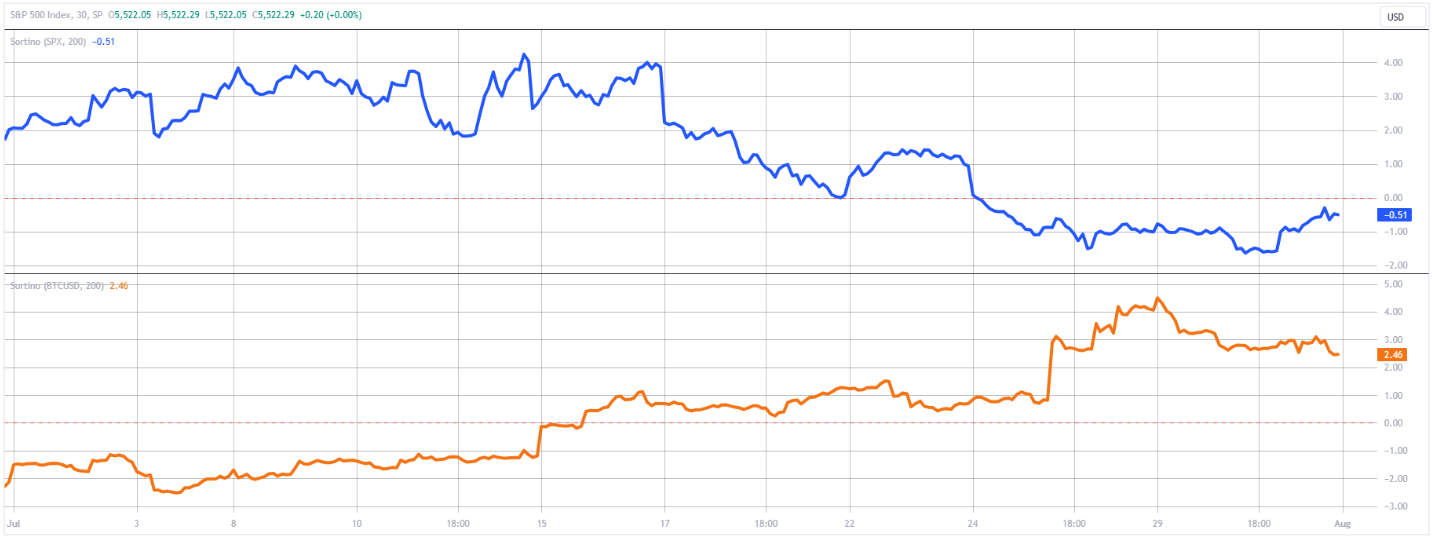
The improvement of BTC’s Sortino ratio in July is derived from the Bitcoin price recovery. As said before, from lowest price point of the month to the highest, Bitcoin gained 27%
Despite the traditionally attractive risk adjusted returns, Bitcoin continues to be a volatile asset, as volatility seems to be a characteristic of all fast growing assets across the board. Saying this, the asset brings upside, better risk-adjusted returns and a better portfolio efficient frontier to any well diversified portfolio.
The continued institutional adoption of Bitcoin is a sign that more institutions understand the importance of having Bitcoin in their portfolio.
TVL Growth Adjusted to Token Price
The chart below shows the TVL - Total Value Locked - adjusted by native token for different chains. This allows us to track the TVL growth normalized by the price appreciation, isolating how much the TVL comes from net new inflows rather than price appreciation.
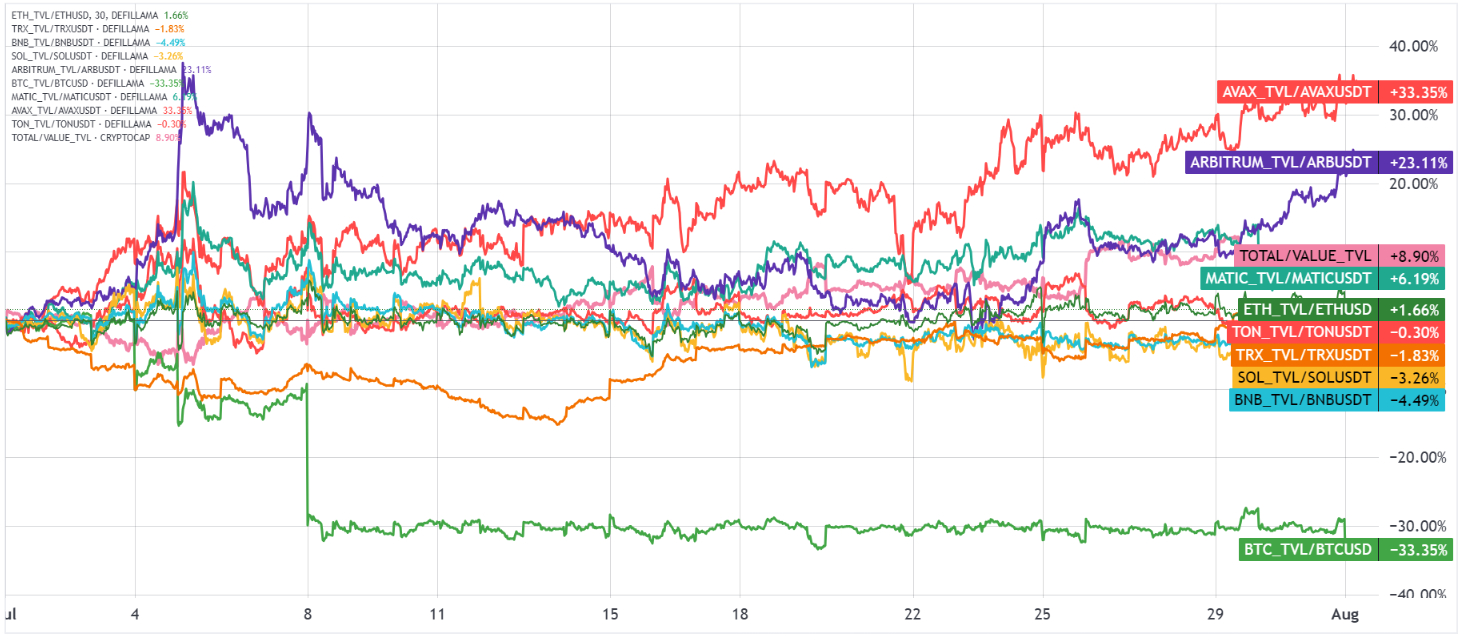
In July, TVL growth outpaced the total market cap growth by 8.9%. This increase comes after the 6.7% growth of last month, and it’s a great indicator that the usage and inflows into different chains are outpacing the prices. This is generally seen as a bullish sign.
TVL adjusted by native token price for the chains analyzed:
Avalanche: +33%
Arbitrum: +23%
Total TVL/Crypto Mcap: +8.9%
Polygon: +6.2%
Ethereum: +1.6%
Bitcoin: -33.3%
BNB: -4.5%
Solana: -3.26%
Tron: -1.8%
Ton: -0.3%
ETF Inflows
July was notably a positive month in terms of Bitcoin inflows into the US spot ETFs. The total AUM increased by 12.6% in July, and according to the chart below from bitcoinetffundflow.com, the total AUM is around $58 billion.
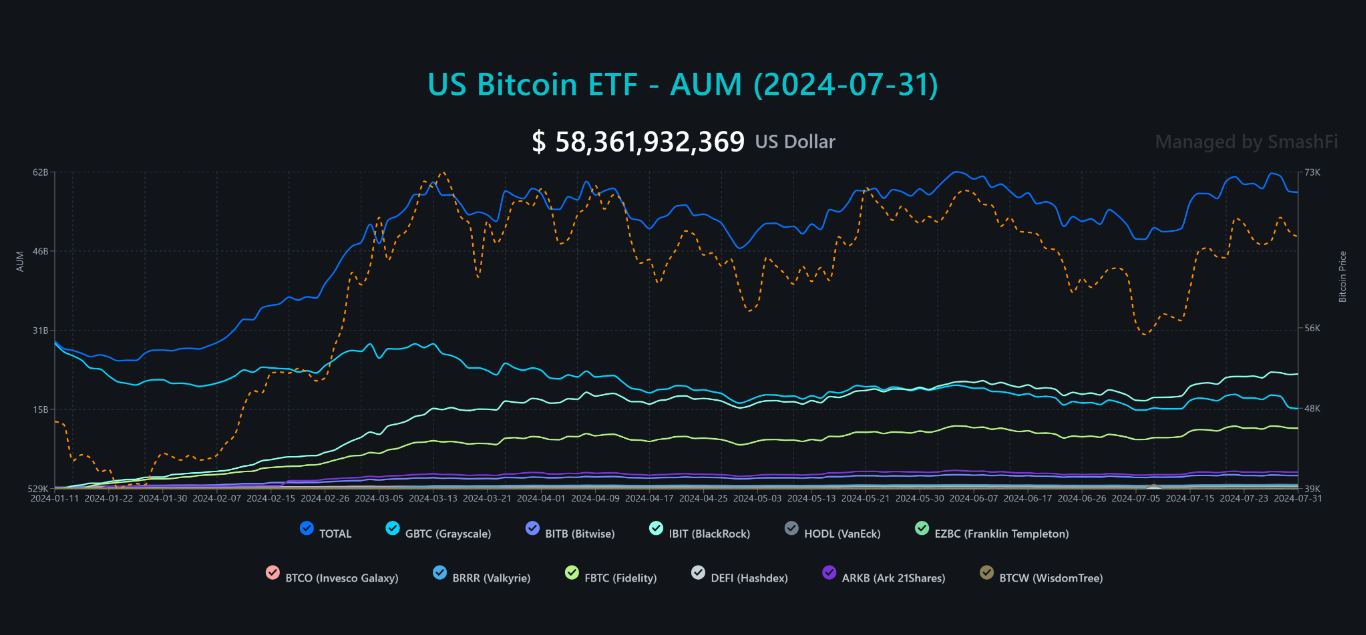
Chart source: bitcoinetffundflow.com
The Ethereum spot ETFs in the US were approved on July 23rd and the data is still very limited. However, during this limited period, the netflow is negative due to the conversion of the Grayscale ETHE, which led to nearly $2 billion in outflows. This is natural, considering the the trust fund was locked and finally they were able to sell.
Despite the outflows, the approval of Ethereum spot ETFs marks a significant milestone for the cryptocurrency industry, as it opens up new avenues for investment and could potentially lead to increased institutional adoption.
Top spot Bitcoin ETFs in Hong Kong:
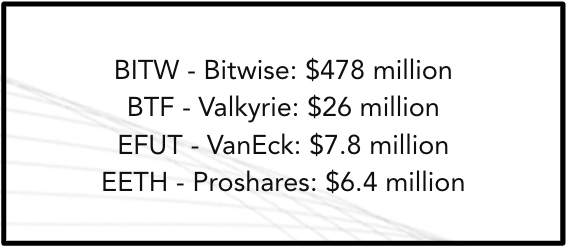
Top 4 spot Ethereum ETFs size:
July Leaders and Laggards
Bitcoin returned 7% in July, while Ethereum returned -6%, most likely due to the Ethereum ETF “sell the news” effect and the Grayscale ETHE outflows.
The general crypto market, excluding BTC and ETH returned 0.5 from the start to the end of the month.
Among the top 100 coins by market cap, 29 ended the month on the green.
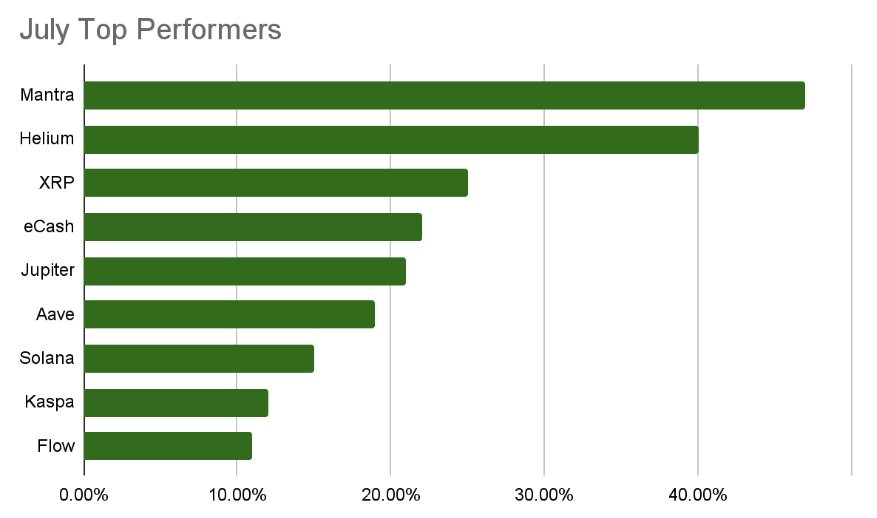
Among the top 100 market cap crypto assets, the best performers in July are:
Mantra: 47%
Helium: 40%
XRP: 25%
eCash: 22%
Jupiter: 21%
Aave: 19%
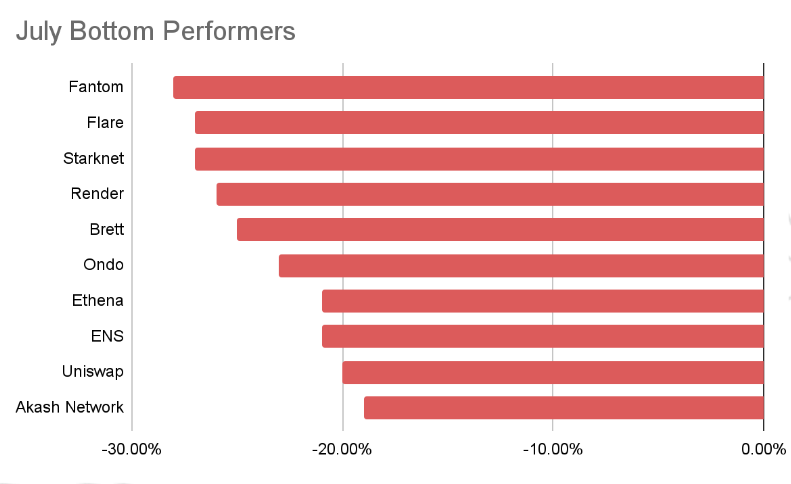
Among the top 100 market cap crypto assets, the worst performers in July are:
Chiliz: -47.00%
Beam: -42.00%
Celestia: -41.00%
Starknet: -40.00%
Ethena: -39.00%
Gala: -35.00%
Price Trends and Technical Analysis
Just like we have predicted on last month’s report, Bitcoin traveled to the closest resistance level, the $67k - $68k, testing this level over the last few days of the month.
Bitcoin has been trading on a descending channel pattern and might be close to a breakout. At this stage, BTC hits the resistance multiple times with increasing strength of price action (higher lows into resistance over the last month).
Currently, the support/resistance levels are:
$63k - $64k
$67 - $68k
$71 - $73k (corresponding to the all-time high)
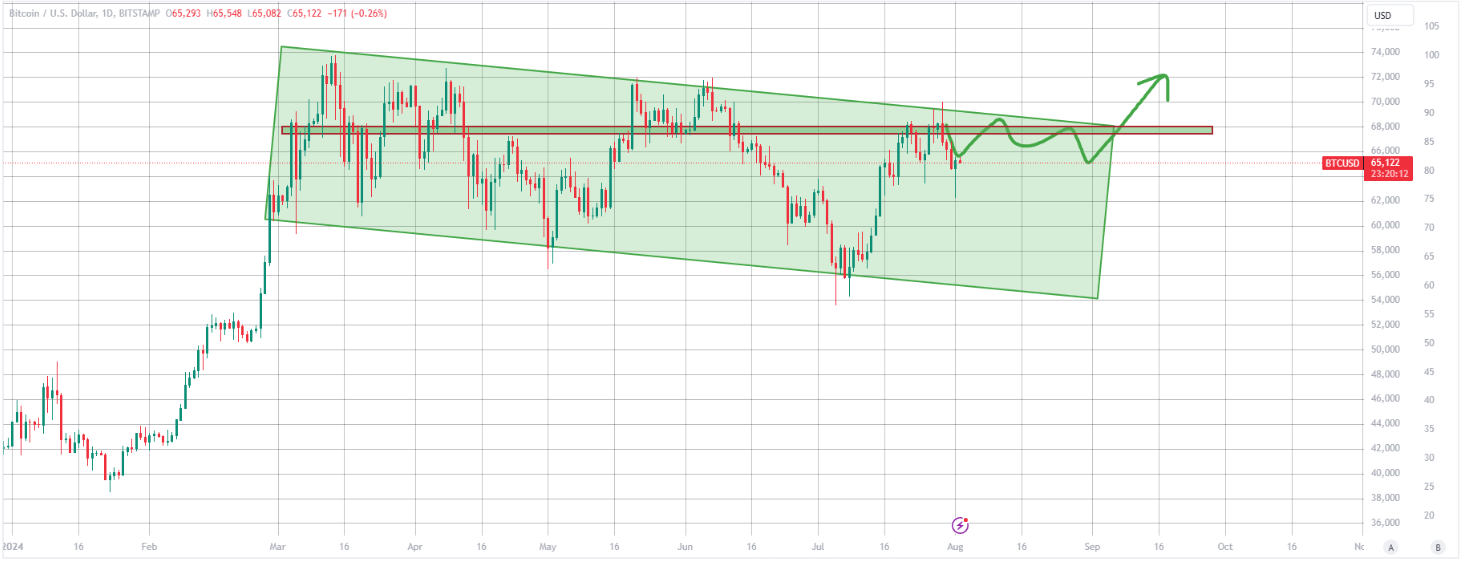
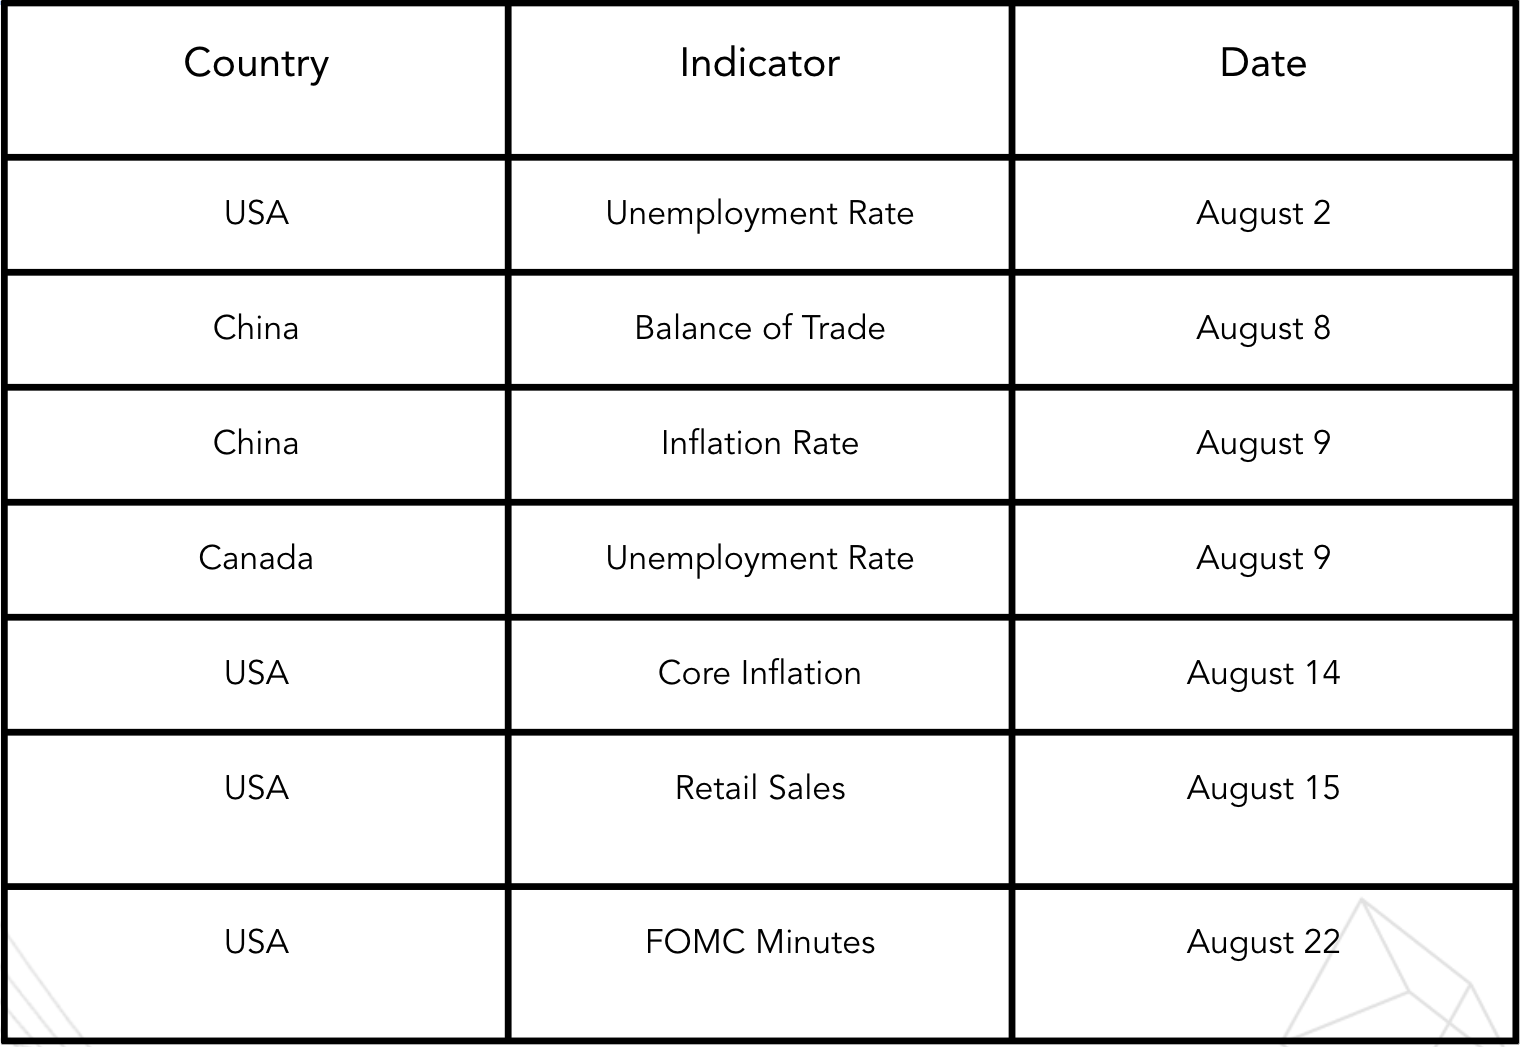
August might have some market catalysts, from unemployment rate, core inflation numbers, retail sales and FOMC minutes. Depending on these numbers and the prospects for market liquidity, Bitcoin might break the $67 - $68k resistance level.
Price Trends and Technical Analysis
The technical oscillators - Bollinger BAnds, CCI, RSI, and MACD show that there are no strong overbought or oversold indicators. Considering these indicators and the currently more positive market mood, the market has room to go up if there are positive market drivers.
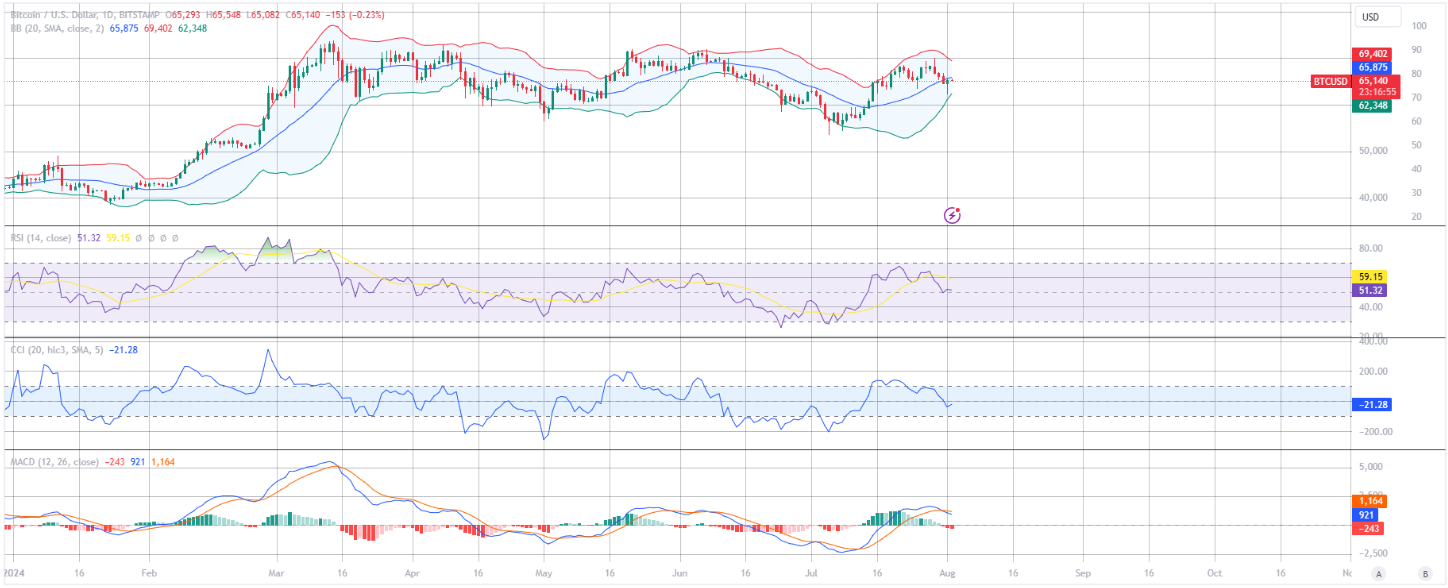
Bollinger bands: Neutral.
RSI: Neutral
CCI: Neutral
MACD: Neutral/Overbought
Bitcoin has experienced a noticeable rally from its previous lows, gaining around 27% from the lowest to the highest point in the recent period.
The price is currently facing resistance around the upper region of the Bollinger Bands, indicating a possible consolidation or pullback phase. The current technical indicators suggest a neutral to slightly bearish outlook for Bitcoin in the short term. The RSI and CCI indicate no extreme conditions, while the MACD suggests bearish momentum. The narrowing Bollinger Bands could imply an upcoming significant price movement, but the direction is uncertain.
Ethereum Supply Variation - A New Paradigm
From the Merge upgrade in September 2022 until the Dencun upgrade in March 2024, Ethereum spent most of the time in a deflationary mode.
This was due to the fact that the Ethereum fee burning mechanism (EIP-1559) outpassed the Ethereum mining inflation.
However, since the Dencun upgrade, Layer 2s pay lower fees to the Ethereum chain, thus generating a lower burn rate on Ethereum. Although this improves the user experience, it is also a new paradigm for the supply/demand of ETH.
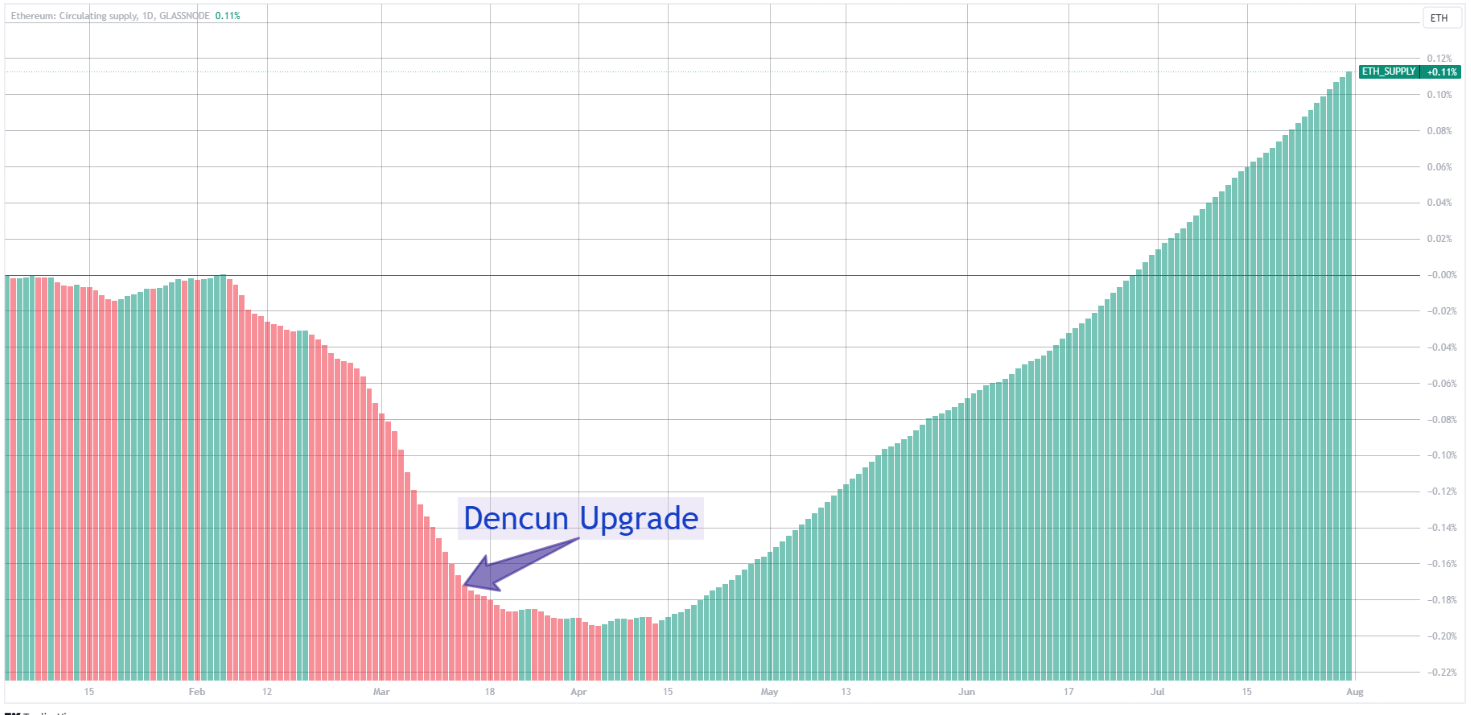
Since the Dencun upgrade in March, the ETH inflation has been 1.08%/year. If this pace continues, the 1.08% inflation can represent up to $4 billion of additional ETH in the market.
This needs to be had into consideration in supply/demand pricing models that, until recently, assumed that ETH would always be deplationary in the future.
As Layer 2 solutions continue to evolve and gain adoption, the long-term impact on Ethereum's supply dynamics will be a key factor to monitor, influencing both market sentiment and long-term valuation models.
Ethereum Active Addresses Dips
Since late June there has been a significant drop in user interaction and transactions on the Ethereum network compared to previous peaks.
The peaks and troughs may also reflect reactions to network upgrades, new dApps launches, or other technical developments within the Ethereum ecosystem.
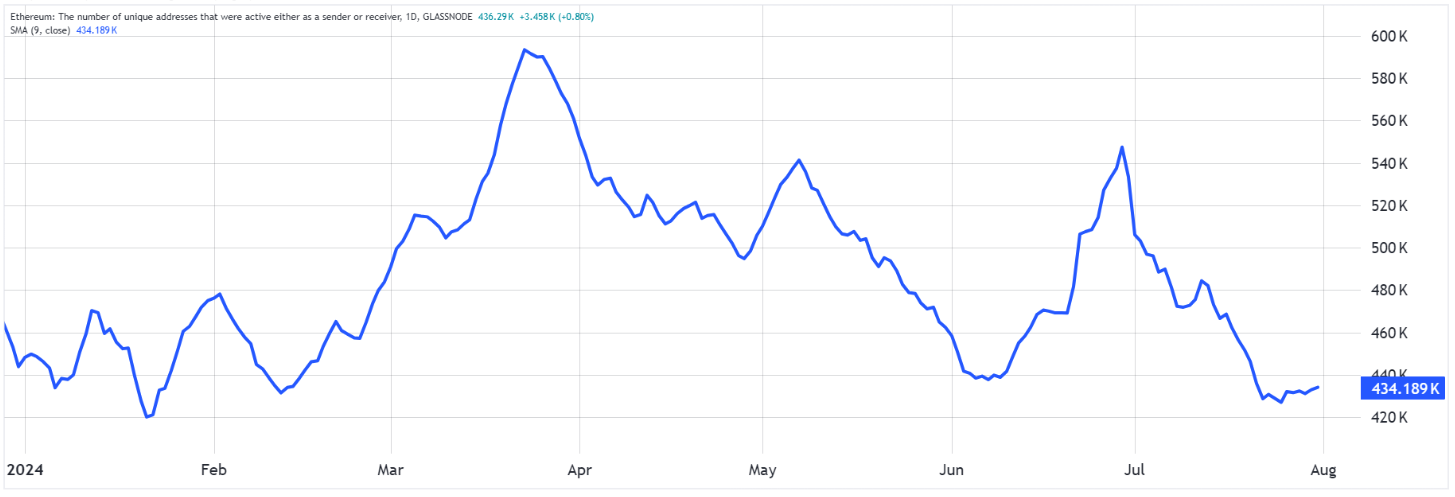
The fact that the layer 2 activity has increased in July, shows that the issue is not related to the crypto ecosystem or to the Ethereum ecosystem, as users continue to interact with the top layer 2 chains, such as Arbitrum, Base, Optimism, Blast, Mantle, Scroll, Linea and zkSync. In fact, many of these L2 saw double digit growth in July.
This might also be an indicator of user’s confidence on L2s and the growing understanding both from users and developers that building and using an L2 instead of the main chain (Ethereum) is in most cases a better option, especially when it comes to transaction fees.
Bitcoin Hashrate
The Bitcoin hashrate hit a six-month low in late June. This low was mostly due to the bitcoin halving, which cut the mining rewards by half, leaving some miners unprofitable, which naturally led to shutting down some mining machines.
July, however, showed a 12% mining hashrate increase, meaning that miners’ capitulation time is finished and miners are back to investing in mining equipment.
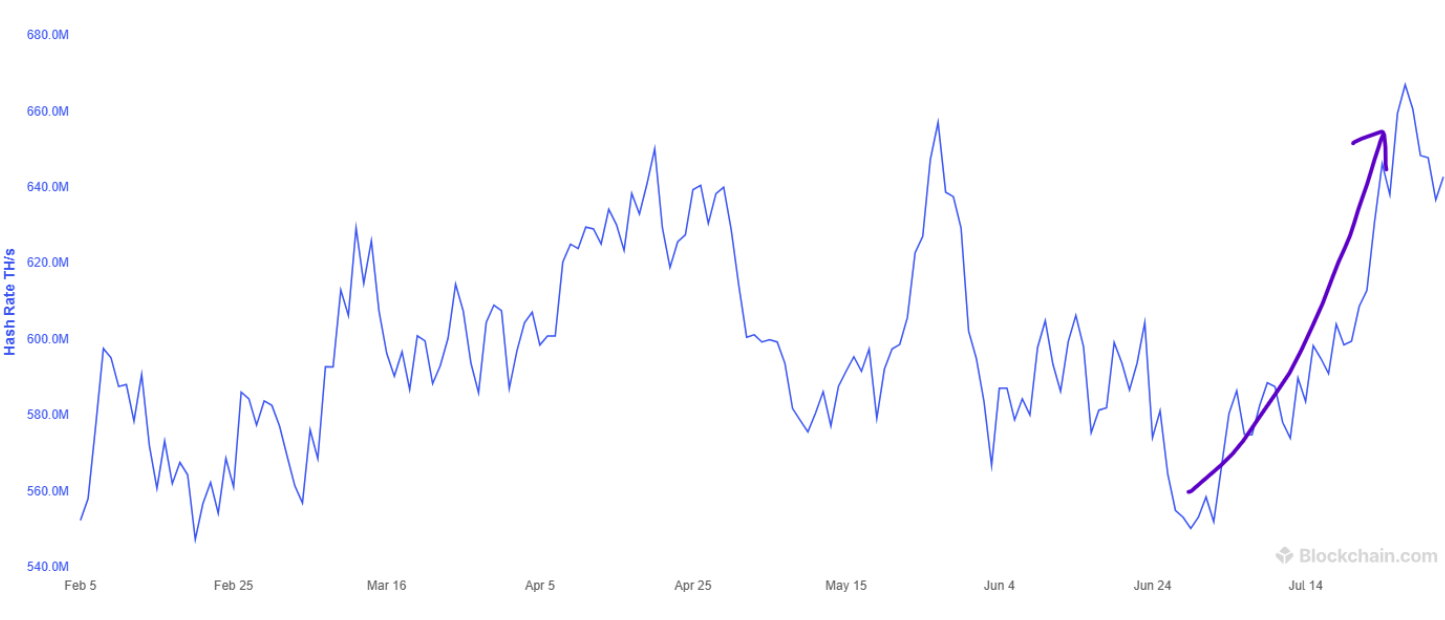
Chart source: Blockchain.com
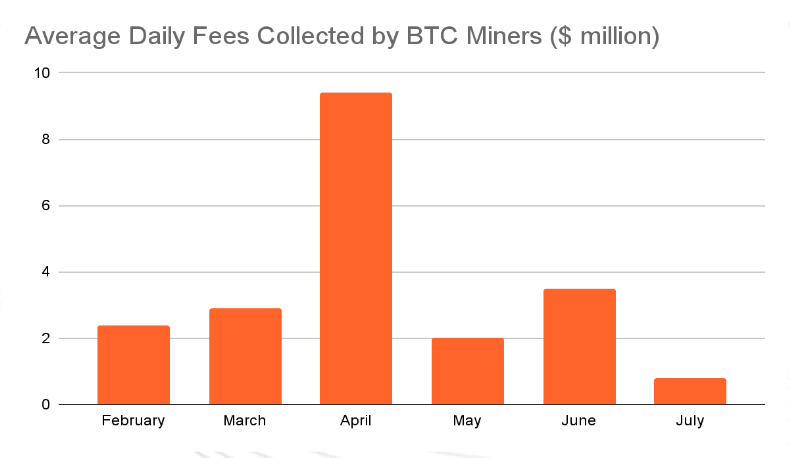
Note however that the transaction fees on Bitcoin have been low in July due to the decline in activity on Bitcoin layer 2 solutions and Bitcoin ordinals.
While the average daily collected fees in June was $3.5 million, in July this number dropped to $800 million. Transaction fees are still an important revenue source for Bitcoin miners.
Spot Volumes
July spot volumes for Bitcoin and Ethereum showed a significant increase, as their were a number o economic and political catalysts that increased trading activity during the month.
Daily average spot volumes:
Bitcoin: $11 billion, +13% MoM growth
Ethereum: $7.2 billion, +41% MoM growth

Chart source: The Block.
Among the market enthusiasm in July, the exchange volume in North-America recorded the second-best month of the year, just behind March, at around $137 billion.

Chart source: The Block.
DeFi Activity
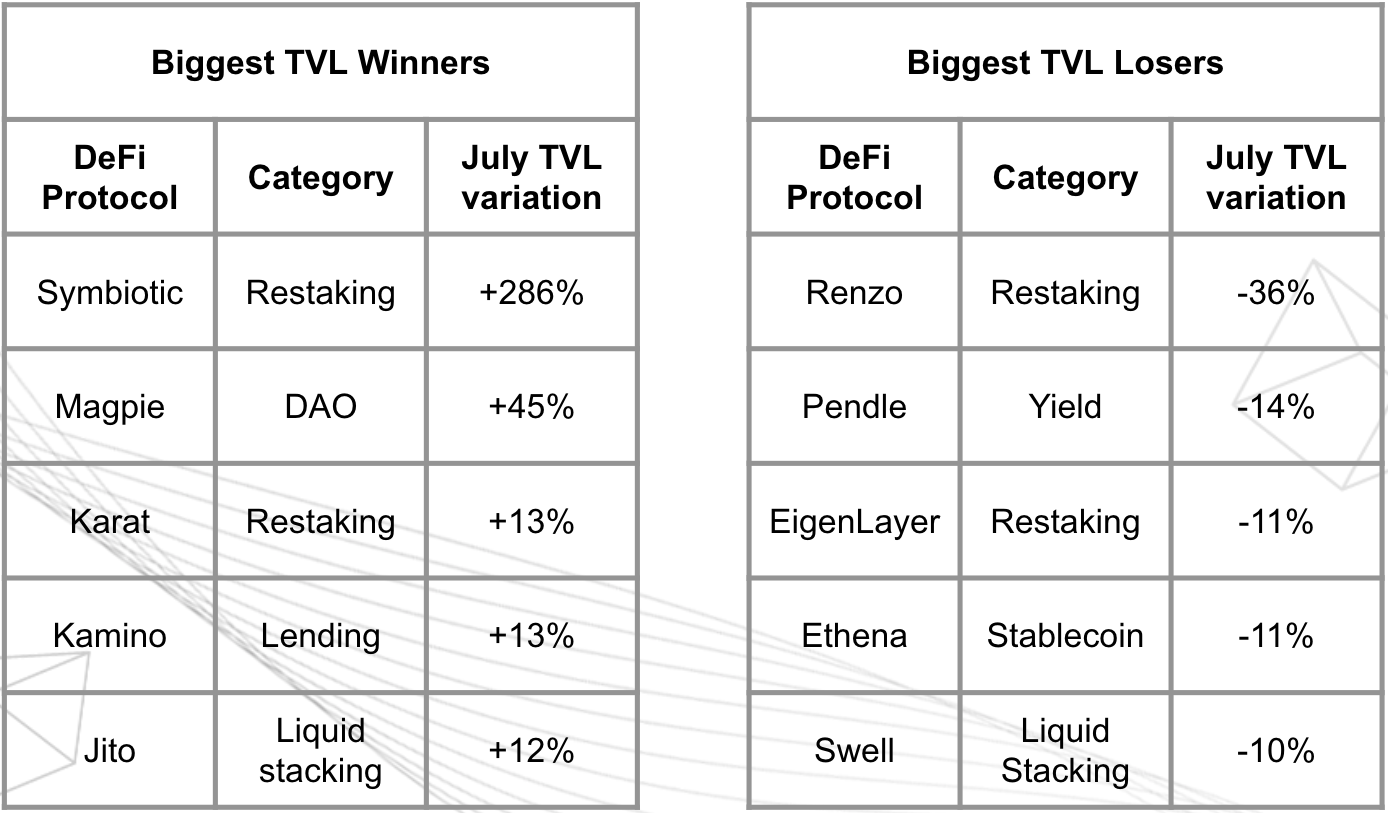
In July, the TVL - Total Value Locked - in DeFi protocols remained unchanged, as typically it trails the market growth, which lacked catalysts in July.
There was no significant adoption of new DeFi primitives.
Note that during the same period, the DeFi coins total market cap declined by -6%. This can be seen as a divergence between the TVL and the market sentiment, suggesting that investors may have been taking profits or reducing their exposure to DeFi tokens while maintaining their locked positions in the protocols.

The Month Ahead
Here are the leading macro indicators and announcements for the month of August, 2024. These indicators will provide key insights into economic conditions and trends across major economies, influencing market sentiment and investment decisions.
DISCLAIMER
This material is for general information only, and does not constitute, nor should it be interpreted as, any form of research output, professional advice, solicitation, offer, recommendation, or trading strategy. No guarantee, representation, warranty or undertaking, express or implied, is made as to the fairness, accuracy, timeliness, completeness or correctness of any general financial and market information, analysis, and/or opinions provided on this report, and no liability or responsibility is accepted by HashKey Capital in relation to the use of or reliance on any such information. Any information on this report subject to change without notice. This report has not been reviewed by the Securities and Futures Commission of Hong Kong, the Monetary Authority of Singapore or any regulatory authority in Hong Kong or Singapore.
Please be aware that digital assets, including cryptocurrencies, are highly volatile and subject to market risks. The value of digital assets can fluctuate significantly, and there is no guarantee of profit or preservation of capital. You should carefully consider your own risk tolerance and financial situation before making any decision.
Distribution of this report may be restricted in certain jurisdictions. This material does not constitute the distribution of any information or the making of any offer or solicitation by in any jurisdiction in which such action is not authorised or to any person to whom it is unlawful to distribute such a report.


