HashKey Capital Monthly Insights Report: April 2024
 HASHKEY CAPITAL
Reading Time: 15.00Min
HASHKEY CAPITAL
Reading Time: 15.00Min

TL;DR
The total crypto market cap increased 27% since the start of the year. Bitcoin nomination stands at 53%
78 crypto assets have a market cap higher than $1 billion.
From January to April 2024, Bitcoin returned 5 times the S&P 500.
Bitcoin’s Sharpe ratio is sitting at 3.
The month of April ended with most indicators in a “oversold” position.
The biggest narratives in April were Layer 1s, AI, gaming, meme coins DePin, and DeFi.
Ethereum price declined by 27% since the Dencun upgrade on March 13, and the Ethereum supply rose by ETH 38,000.
The Dencun upgrade greatly benefited Layer 2 revenue and fees paid by the users.
Trading volumes and open interest remain high compared to the previous year.
The spot Bitcoin ETF ended April with a $52 million AUM. Hong Kong launched six crypto asset ETFs.
In both March and April, VCs invested over $1 billion in crypto startups.
Post Bitcoin halving on April 19th, the Bitcoin hashrate declined by 7.5%. On the other hand, April was the best month even in terms of Bitcoin fees.
April highlights
April 5 — Ethena onboards BTC as a backing asset for USDe
April 6–9 — The Hong Kong Web3 Festival, organized by HashKey, attracted over 30,000 people
April 7 — The book Crypto Asset Valuation Framework was published
April 8 — For the first time in 2 years, DeFi’s TVL — Total Value Locked — crossed the $100 billion mark.
April 8 — Bitcoin reached $72,300
April 9 — Monada Labs fundraised $225 million led by Paradigm
April 10 — HashKey announced the Layer 2 HashKey chain
April 11 — Uniswap receives enforcement notice from the SEC
April 15 — Bitcoin has its fourth having to cut the mining reward to BTC 3.125
April 24 — Blackrock’s spot Bitcoin ETF has experienced 70 consecutive days of net inflows
April 30 — Six Crypto Asset ETFs went live in Hong Kong, including HashKey’s spot Bitcoin and Ethereum ETFs
Introduction
This report provides an in-depth analysis of the cryptocurrency market during the first four months of 2024 and a special focus on April 2024. The total crypto market capitalization increased by 27% from the start of the year until the end of April, despite a 20% correction during the month of April. Bitcoin, which accounts for 53% of the entire crypto market cap, returned 30% for the first four months of 2024, outperforming traditional assets such as the S&P 500.
In April 2024, the crypto market experienced significant events and developments. The Bitcoin halving, a pivotal event that reduces the reward for mining Bitcoin transactions, was set to occur between April 16–20, sparking excitement and anticipation within the crypto community. This event has historically been associated with price volatility and is expected to impact the supply dynamics of Bitcoin.
The total crypto market capitalization continued its upward trajectory, reaching a new high of $2.9 trillion in March, showcasing a strong rally in the first quarter of 2024. This growth was largely driven by the approval of US spot Bitcoin ETFs in January, which played a crucial role in boosting Bitcoin’s price to a new all-time high in March.
Ethereum also saw notable developments with restaking on EigenLayer, hitting 4.3 million ETH, a quarterly growth of 36%. This indicates a growing interest in staking and the Ethereum ecosystem. The approval of US spot Bitcoin ETFs and the anticipation of Ethereum spot ETFs have further bolstered market sentiment.
Solana was also in the spotlight, with Solana’s memecoins surging in market cap by $8.32 billion in the first quarter of 2024.
Overall, April 2024 was marked by a mix of anticipation, excitement, and volatility in the crypto market, driven by major events like the Bitcoin halving and significant developments in the altcoin space.
Crypto Market Capitalization
The total crypto market capitalization increased 27% from the start of the year until the last day of April. The current market cap of $2.11 trillion is only 25% lower than the all-time high of $2.8 trillion in November 2021. Bitcoin corresponds to 53% of the entire crypto market cap.
April was a month of correction for crypto, considering the decline of 20%. On the other hand, it’s important to note that crypto started the year very strong, with a 70% surge from the start of the year until March 14. Consequently, this correction comes as a natural response to an overbought market.
At the moment, 14 different crypto assets have a market cap higher than $10 billion, and 78 have a market cap higher than $1 billion.
Bitcoin vs. Benchmark Assets
Bitcoin returned 30% for the first 4 months of 2024. Compared to other traditional assets, Bitcoin and other crypto assets have shown interesting excess returns and risk-adjusted returns, as we will see later.
Although this year has been very positive for the stock market, Bitcoin returned 5 times the stock market (S&P 500). Note that Bitcoin is typically the crypto asset with the lowest volatility and that many other crypto assets returned multiples of Bitcoin return. For instance:
Toncoin 107%
Dogwifhat 1,637%
Arweave 201%
Fetch.ai 193%
Jupiter 4,629%
Volatility and Sharp Ratio
Although crypto is usually seen as a volatile asset class, its risk-adjusted returns are usually tractive compared to other asset classes. Although crypto assets are traditionally seen as risk-on assets, they also offer better risk-adjusted returns than traditional assets. In other words, the returns are attractive, considering the volatility that investors have to endure.
Over the first 4 months of the year, Solana saw the best returns among the high-capitalization coins. On the other hand, Bitcoin saw an excellent Sharpe ratio of 3, meaning that it had great returns for the amount of risk provided. Typically, we would prefer to see assets on the right side of the chart below.
Price trends and TA
Bitcoin’s 6-month regression trend is at $67,500 (while BTC price is at $57766), meaning that BTC can eventually pull back to the $67,000 level while continuing its growth trajectory.
At the moment, momentum oscillators are mostly neutral to oversold.
Bollinger bands: Oversold.
RSI: Neutral/oversold
CCI: Oversold.
MACD: Oversold.
Fear and Greed: Neutral.
From the levels illustrated in the charts above, we can expect a pull back to the $67,000 level.
BTC vs ETH
ETH has been losing territory against BTC. ETH/BTC declined by 6% since the start of the year. This can, from one side, show that ETH has been lagging behind BTC’s price action. On the other hand, it can be seen as a bullish sign as ETH (and the respective L2 ecosystem) have more room to grow.
Over the month of April, the biggest narrative for retail was meme coins. Among the 10 best performers against BTC (top 100 market cap), we can find 2 meme coins: Bonk, and Pepe.
The other top performers (against BTC) are:
Neo (+22%) — Sector: Layer 1
Toncoin (17%) — Sector: Layer 1
Tron (16%) — Sector: Layer 1
BNB (12%) — Sector: Layer 1
Ondo (11%) — Sector: RWA
The top trends are still meme coins, AI, gaming, DePIN, and DeFi, the latter with a lot of attention going to LSTfi, restaking and DeFi on emerging chains like Linea.
Ethereum Price and Upgrades and Burn
ETH closed 2024 Q1 at $3,507, representing a 59.9% increase in the quarter. The peak of this period happened right before the Dencun upgrade (March 13th). The Dencun upgrade includes EIP-4844, also known as Proto-Danksharding led to a significant reduction in fees paid by layer 2 chains, greatly improving the user experience on the Ethereum ecosystem. Users transacting on L2 rollups can now experience transaction fees under $0.01.
Since the start of the year, ETH price has increased by 15%, MoM, the price declined 9%, and since the Dencun upgrade on March 13th, the price has declined by 27%.
Since the Merge upgrade (September 2022), Ethereum has become deflationary and the net supply was reduce by close to ETH 1 million (over $3 billion). During Q1 alone the Ethereum circulating supply decreased by 0.2%.
Since the start of the year, the ETH supply declined by 0.16%, representing a reduction of 187,000 ETH, worth approximately $650 million. However, in April, ETH supply increased by approximately 38,000 ETH.
Monthly Ethereum supply variation

Layer 2 Adoption
Layer 2 networks currently handle over $36 billion in TVL and process 11 times the transaction capacity of the Ethereum network.
Since the Ethereum Dencun upgrade on March 13th, the Layer 2 user experience has improved significantly, especially when it comes to transaction fees. In some cases, transaction fees saw over 90% reduction.
The Proto-Danksharding introduced Blobs. Data blobs are like attachments to the blocks.
The main beneficiaries of the upgrade will the the Ethereum rollup chains, which now have cheaper fees and faster transaction settlement.
By making roll-up transactions faster and cheaper, the upgrade is going to improve user experience and likely increase user adoption of the Ethereum ecosystem (including to face competitors).
This will have positive impacts on layer 2s as they become cheaper, and it’s likely to increase their revenue.
Other than Proto-Danksharing, here are the other upgrades included in the Dencun upgrade:
EIP-1153: The Forkless Frontier — it aims to allow future network upgrades without the need for hard forks
EIP-4788 and State Receipts Vouchering — improves the communication between the conseusns layer and the execution layer for better network efficiency. The state receipt vouchers are contain only the essential info about transactions.
EIP-5656 and MCOPY Opcode — Smart contract efficiency by improving memory operations. This translates into faster execution and lower tx fees.
EIP-6780 and SELFDESTRUCT Gas Metering — better gas calculation for selfdestruct functions.
All these updates are part of the Ethereum long term roadmap which has as endgame, transforming Ethereum into the settlement/security layer of the internet.
Spot volumes
March 2024 was the fourth-best month ever in terms of volume, with an exchange volume of $2.48 trillion. The high volumes reveal increased market activity, market trend confirmation, and institutional interest.
On the other hand, April saw a decrease in volume to the average yearly volume of approximately BTC 500,000 per day.
CEX volumes increased by 95% in Q1 2024, while DEX volumes increased by 78%. April saw a -31% volume decline when compared to March, although its still way above the 6-month average monthly volumes.
In March, open interest also reached a 2-year high, more than doubling QoQ. This is a bullish sign for Bitcoin as more money flows to the market.
In the period from April 12 to 14 there was a significant decline in open interest as market volatility triggered liquidations, exacerbating Bitcoin’s price fluctuation.
Futures data
Funding rates have been generally high and positive, indicating a larger amount of long positions when compared to short positions.
However, the liquidations triggered in April took the funding rates into the negative territory.
Spot Bitcoin ETF
The US spot Bitcoin ETFs finished the month of April with a $52 billion AUM. The Blackrock ETF made history by striking 72 consecutive days of positive net inflows, ending the month with a $16.4 billion AUM.
HashKey also made history on April 30th by being part together with Borsera of the very first batch of spot Bitcoin and Ethereum ETFs in Hong Kong. The HashKey BTC ETF trades with the ticker 3008 and the ETH ETF with the ticker 3009.
Crypto Venture Capital activity
Venture capital activity has been increasing when compared to most activity in 2023. In both March and April, crypto startups saw an inflow of over $1 billion monthly.
Market share and dominance and M2 correlation
The crypto market capitalization and US M2 have a 0.83 10-year correlation. We can also observe that despite M2 not having a significant increase over the last 2 years, the crypto market cap has been increasing significantly.
The line in the middle shows the ratio crypto_market_cap/USM2, now sitting at 0.10. This basically means that if we are to compare the crypto market size to the US M2, crypto represents 10% of it.
Interpretation: crypto assets are gaining popularity and absorbing more capital from the markets. This ratio is close to the previous ATH of 0.14. However, there’s a main difference: the previous 0.14 ATH was in Nov. 2021, when the market had a significant momentum from very loose monetary policies. This means that the current market surge is riding more on fundamentals rather than on simple momentum from money printing.
Bitcoin Vs. Google Trends
According to our analysis, there’s a significant correlation between Google trends (the frequency of Google searches) and the price of Bitcoin.
Coincidentally, lower volumes of Google searches signify quiet times in the market from the retail perspective and, consecutively, a better time to buy.
When compared to last year, Bitcoin Google trends data shows a steep increase in Google searches for Bitcoin. Note, however, that over time, it’s likely that fewer people search for Bitcoin as more people already know what Bitcoin is. Although Google search declined in April, the search volume is still above 90% in all historical months.
Bitcoin mining hashrate and hash metrics and mining revenue per terahash
The Bitcoin hashrate measures the amount of computing power on the network and also translates into how secure the network is.
Despite the fact that we are close to a Bitcoin halving, we continue to see the hashrate reaching no all-time highs, increasing by 2% in Q1 2024.
However, after the April 19th Bitcoin halving that cut the mining rewards from 6.25 to 3.125, the mining hashrate declined by 7.5%. As the miner rewards are cut, miners with higher costs will no longer be feasible.
It’s important to note however that April 2024 was the best month ever in terms of transaction fees paid by users. This is also an important source of revenue for the miners.
With the growth of network activity and with the resurgence of BRC-20, Runes and Bitcoin L2 chains, it’s likely that transaction fees will continue growing and eventually suplant block rewards as the main revenue source for miners.
Bitcoin realized P&L
In March 2024, Bitcoin hit a new realized profit/loss high. However, the realized profit/loss became negative in late April. This important indicator uses the concept of pricestamping where each UTXO is assigned a price.
When the value is negative, it means that investors are likely to be selling Bitcoin at a loss. This is a sign of capitulation (and usually a relatively good time to buy).
This can be read as a sign that the market correction gave it additional room to grow.
DeFi activity
Over the last 6 months, we have seen an significant increase in DeFi activity. The DeFi market capitalization rose from 17% to 25% of the Ethereum market capitalization, illustrating the acceleration of DeFi activity when compared to the ETH price dynamics.
Simultaneously, DeFi was one of the biggest winners in the space. As it can be seen on the chart below, the DeFi market cap rose from $35 billion to $120 billion over a 6 month period.
Additionally, the DeFi total TVL — Total Value Locked — rose by 60% YTD. During the month of April, the TVL contracted by approximately 10%.
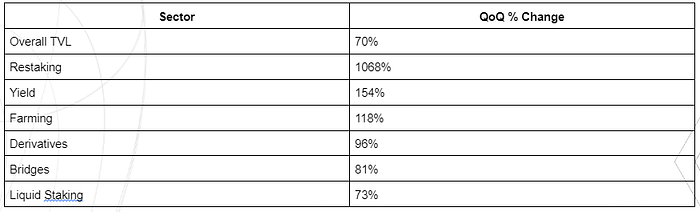
DeFi ecosystem overview
Since early 2024, liquid staking has been the dominating DeFi sector in terms of TVL. However, other use cases, such as staking and yield, saw substantial inflows too. This is thanks to protocols such as EigenLayer, EtherFi, Zircuit, Swell, Puffer, and Pendle.
Authors
Jupiter Zheng, Partner, Liquid Funds and Research
Vivien Wong, Partner, Liquid Funds
Henrique Centieiro, Research Manager
Disclaimer
This material is for general information only, and does not constitute, nor should it be interpreted as, any form of research output, professional advice, solicitation, offer, recommendation, or trading strategy. No guarantee, representation, warranty or undertaking, express or implied, is made as to the fairness, accuracy, timeliness, completeness or correctness of any general financial and market information, analysis, and/or opinions provided on this report, and no liability or responsibility is accepted by HashKey Capital in relation to the use of or reliance on any such information. Any information on this report subject to change without notice. This report has not been reviewed by the Securities and Futures Commission of Hong Kong, the Monetary Authority of Singapore or any regulatory authority in Hong Kong or Singapore.
Please be aware that digital assets, including cryptocurrencies, are highly volatile and subject to market risks. The value of digital assets can fluctuate significantly, and there is no guarantee of profit or preservation of capital. You should carefully consider your own risk tolerance and financial situation before making any decision.
Distribution of this report may be restricted in certain jurisdictions. This material does not constitute the distribution of any information or the making of any offer or solicitation by in any jurisdiction in which such action is not authorised or to any person to whom it is unlawful to distribute such a report.