HashKey Capital Monthly Insights Report: May 2024
 HASHKEY CAPITAL
Reading Time: 8.94Min
HASHKEY CAPITAL
Reading Time: 8.94Min

TL;DR
May 2024 was a positive month for the crypto market, with some catalysts such as the FIT21 bill, U.S. Presidential campaign and the sudden Spot ETF approval bringing a renewed bullish sentiment to the market.
The total crypto market cap increased by 15%, from $2.15 trillion to $2.49 trillion.
Many crypto assets in the top 100 market cap grew double digits, most notably JasmyCoin: 101%, Ondo: 70%, Kaspa: 61%, Notcoin: 55% and Ethena: 33%.
The ETH/BTC price rose 25% in May.
The Bitcoin spot ETFs AUM rose by 4% in the month.
The DeFi TVL had a significant boost in May: +22%.
MAY 2024 HIGHLIGHTS
Bitcoin reached a new high for the year, and surpassed the $70,000 level for three days.
Ethereum came close to reaching $4,000 following a positive verdict from the SEC on Ethereum-based ETFs.
Uniswap led the way in terms of token performance, with a 53.59% increase. Chainlink and Chiliz also experienced notable increases.
The crypto industry amassed one of the largest US presidential campaign donations with companies like Coinbase donating $25 million.
Pizza Hut started accepting Bitcoin payments in El Salvador, showing increasing adoption of cryptocurrencies in everyday transactions.
Farallon Capital revealed an $85.2 million investment in GBTC, demonstrating institutional interest in Bitcoin investment vehicles.
Introduction — May 2024: A Pivotal Month for Crypto
May 2024 stood out as a month of significant growth, marked by a series of pivotal events that boosted the market’s bullish sentiment. Against the backdrop of the FIT21 bill, the U.S. Presidential campaign, and the unexpected approval of a Spot ETF, the total crypto market cap experienced a 15% surge, catapulting from $2.15 trillion to an impressive $2.49 trillion.
This period was characterized by substantial gains for many top 100 market cap crypto assets. The month also witnessed a significant rise in the ETH/BTC price, which climbed 25%, and a 4% growth in Bitcoin spot ETFs AUM.
The DeFi sector experienced a substantial boost, with the Total Value Locked (TVL) increasing by 22%. Bitcoin, in particular, soared above the $70,000 level for three days, and Ethereum nearly touched the $4,000 mark following a favorable SEC verdict on Ethereum-based ETFs.
Uniswap led the way in token performance with a 53.59% increase, closely followed by notable gains from Chainlink and Chiliz. The crypto industry demonstrated its financial clout by amassing one of the largest U.S. presidential campaign donations, with Coinbase donating $25 million.
Further signaling mainstream adoption, Pizza Hut in El Salvador began accepting Bitcoin payments. Institutional interest in Bitcoin investment vehicles was also evident, with Farallon Capital revealing an $85.2 million investment in GBTC.
Crypto Market Capitalization
May 2024 was a strong month for the crypto market, with the total crypto market cap increasing by 15%, from $2.15 trillion to $2.49 trillion. Bitcoin’s dominance is now at 52.5%, down from 53% in the previous month.
Compared to the month of April where the crypto market cap declined by -15%, the 15% recovery in May brings a new sense of optimism in the crypto market.
From the start of the year, the crypto market cap increased by 55%. In comparison, the S&P 500 increased by 11% YTD.
Some of the catalysts for the optimism in May are the Ethereum ETF approvals by the SEC, the FIT21 bill, the U.S. elections with the former president and candidate Donald Trump endorsing and accepting crypto for his campaign and the general positive outlook for the economy.
Bitcoin Vs. Benchmark Assets
Bitcoin returned 13% in May making it the best performing asset when compared to other assets. Bitcoin has also demonstrated good risk adjusted returns with a Sharpe Ratio of 2.
Among the top 100 market cap crypto assets, the best performers in May are:
JasmyCoin: 101%
Ondo: 70%
Kaspa: 61%
Notcoin: 55%
Ethena: 33%
Uniswap: 29%
Monero: 27%
Chainlink: 25%
Pendle: 21%
Arweave: 19%
Risk Adjusted Returns
The chart below correlates the 1-month returns and the Sharpe ratio of selected crypto assets.
Toncoin, Solana and Ethereum were among the best performers among the high-capitalization coins, all with Sharpe ratios over 2, meaning that it had relatively good returns for the amount of risk/volatility experienced during the reference period. Typically, we would prefer to see assets on the right side of the chart, as the correlation between returns and volatility is the best. A higher Sharpe ratio indicates that an asset has delivered superior returns for the level of risk taken.
Price Trends and Technical Analysis
Bitcoin started its uptrend since January 2023, reaching an all time high of $73k in March 2024. Since then, the price has been trading sideways. Currently, the support levels are at the $67k-$68k area and the $63k-$64k area. The price might still test these support areas before moving through the $71k-$73k resistance area and eventually reaching new all time highs.
If Bitcoin continues the uptrend initiated in Jan. 2023, it could touch $76k by the end of June.
Below we analyze a number of momentum oscillators that typically identify overbought and oversold areas.
Currently, most of the indicators show a neutral market situation without any strong overbought or oversold indicators.
At the moment, momentum oscillators are mostly neutral to overbought.
Bollinger bands: Neutral.
RSI: Neutral
CCI: Overbought.
MACD: Neutral.
Fear and Greed: Neutral.
From the levels illustrated in the charts above, we can expect either a sideways market or small uptrend during June.
Bitcoin Vs. Ethereum
May was a positive month for Ethereum. After losing ground to Bitcoin for months, ETH rose 25% when compared to BTC. This move came mainly after the Ethereum approval by the SEC.
The chart below illustrates that the ETH/BTC downtrend that has been observed since the start of the year reverted in May. This is positive not only for the Ethereum ecosystem but also for altcoins in general.
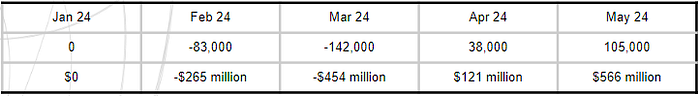
Despite the renewed bullish sentiment around ETH, the asset has been inflationary during the month of May, due to low volume of transaction fees paid on the network (chart below). This added 105,000 new ETH to the chain.
Spot Volumes
Q1 saw a strong increase in trading volumes with March reaching very significant spot volumes of close to $2.5 trillion. May volumes were lower, reaching $1.24 trillion CEX volume and $88 billion DEX volume. The DEX volumes are still over the 1 year average volume.
The decline of spot volumes in May, relatively low DEX volumes, paired with other data covered in this report such as neutral momentum indicators and quiet Google searches, might indicate that retail investors are not as active and that currently, the market has been mostly driven by institutional investors.
Spot Bitcoin ETFs
It has been over 5 months since the spot Bitcoin ETFs were approved. In May, the Bitcoin ETF AUM had a small increase in AUM, starting the month at $52 billion and ending at $54 billion — approximately a 4% increase.
Note that the US spot Gold ETFs currently have a $129 billion AUM, meaning that the still very young Bitcoin ETFs have a significant size, corresponding to 41% of the gold ETFs.
Bitcoin Google Trends
According to our analysis, there’s a significant correlation between Google trends (the frequency of Google searches) and the price of Bitcoin.
Coincidentally, lower volumes of Google searches signify quiet times in the market from the retail perspective.
Since March 2024 there’s been a decline in Google searches for Bitcoin. This can be interpreted as a lower interest from retail. However, the retail interest trails the price, meaning that we expect Google trends to grow next month.
DeFi Activity
Over the last 6 months, we have seen a significant increase in DeFi activity. The DeFi market capitalization (chart below) rose from 17% to 23% of the Ethereum market capitalization, illustrating the acceleration of DeFi activity when compared to the ETH price dynamics.
The DeFi sector was one of the biggest winners in the space in May, increasing its market capitalization by 13% in the month. Since the start of the year, the DeFi market cap increased by 47%, and since January 2023, it increased by 240%.
The DeFi TVL — Total Value Locked — also had a very significant growth in May, starting the month at $87 million and finishing it at $106 billion, a 22% growth.
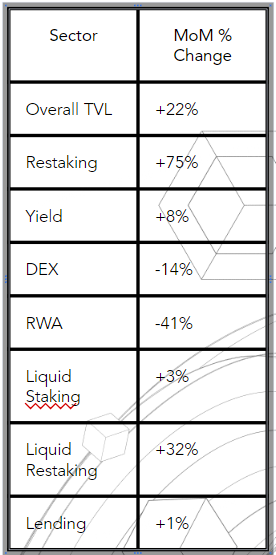
When it comes to DeFi sectors, Liquid Staking continues to be the dominant DeFi sector, growing by 3% in May. Lending remained unchanged, while Restaking was the sector that grew the most in May, increasing its TVL by an additional 75%.
The sector losing the most in May was RWA, which declined its TVL by 41%. This might have been motivated by the decline in TVL from Maker.
*All figures used in this report are as of 31/05/2024
DISCLAIMER
This material is for general information only, and does not constitute, nor should it be interpreted as, any form of research output, professional advice, solicitation, offer, recommendation, or trading strategy. No guarantee, representation, warranty or undertaking, express or implied, is made as to the fairness, accuracy, timeliness, completeness or correctness of any general financial and market information, analysis, and/or opinions provided on this report, and no liability or responsibility is accepted by HashKey Capital in relation to the use of or reliance on any such information. Any information on this report subject to change without notice. This report has not been reviewed by the Securities and Futures Commission of Hong Kong, the Monetary Authority of Singapore or any regulatory authority in Hong Kong or Singapore.
Please be aware that digital assets, including cryptocurrencies, are highly volatile and subject to market risks. The value of digital assets can fluctuate significantly, and there is no guarantee of profit or preservation of capital. You should carefully consider your own risk tolerance and financial situation before making any decision.
Distribution of this report may be restricted in certain jurisdictions. This material does not constitute the distribution of any information or the making of any offer or solicitation by in any jurisdiction in which such action is not authorised or to any person to whom it is unlawful to distribute such a report.