HashKey Capital Monthly Insights Report: August 2024
 HASHKEY CAPITAL
Reading Time: 10.77Min
TL;DR
Market Decline: August began with a notable market downturn, driven by the Bank of Japan's interest rate hike, prompting Bitcoin to drop 25% initially.
The total crypto market cap fell by 10.9% MoM.
Institutional Activity: Marathon Digital announced adding $250 million in Bitcoin, reinforcing its position as the second-largest public holder.
ETF Trends: US Bitcoin ETF AUM declined to $53 billion, while Hong Kong ETFs surpassed HKD 2 billion.
Technical Analysis: Bitcoin remains at a critical juncture, with potential for a bullish breakout if it surpasses key resistance levels.
Despite poor price performance, indicators such as social media activity and hashrate show positive signs.
August 2024 Highlights
At the start of the month, markets had a sharp decline across the board, due to the Bank of Japan interest rate hike.
The stablecoin market capitalization reached a new all-time high.
Bitcoin on exchanges reached a 6-year low.
US August CPI was at 2.9%, lower than the 3% expectation.
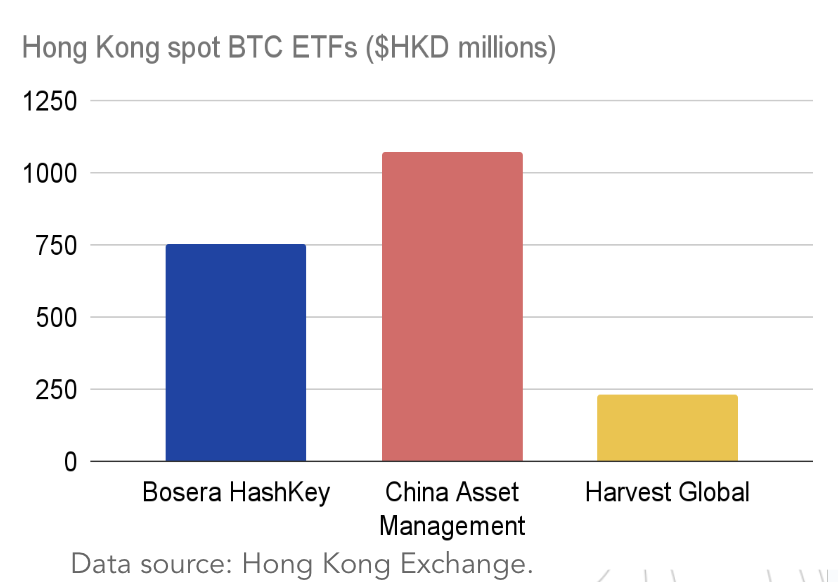
Hong Kong spot Bitcoin ETFs surpassed $2 billion HKD.
Despite a sideways August, cryptos such as Helium, Aave, Tron and Sui swa significant price increase.
The U.S. presidential election has introduced uncertainty but also optimism if crypto-friendly policies are adopted.
The TON blockchain suffered a several hour long outage.
OpenSea, the biggest NFT marketplace, received a Wells notice from the SEC.
Sony launched Soneium Blockchain, an Ethereum Layer-2.
Franklin Templeton files for a crypto index ETF.
Introduction - Crypto Market Overview - Aug. 2024
August 2024 proved to be a month of volatility and resilience in the cryptocurrency market. Economic factors influenced investor sentiment, the market faced a sharp decline early in the month, driven by the Bank of Japan's interest rate hike. This led to significant sell-offs across multiple asset classes, and with Bitcoin experiencing a 25% drop in just one week. However, by month-end, Bitcoin managed to partially recover.
Notably, institutional investment trends showed contrasting signals; while U.S. spot Bitcoin ETFs saw a decline in assets under management, Hong Kong's ETFs thrived, surpassing HKD 2 billion.
Additionally, the social media activity around Bitcoin surged, indicating a potential divergence in sentiment as retail investors remained engaged despite bearish futures prices.
Despite the overall market correction, certain cryptocurrencies like Helium (up 35%) and Tron (up 23%) showcased resilience, indicating pockets of investor interest that defy broader trends.
In this report, we look into a comprehensive analysis of market performance, sector trends, and the implications of macroeconomic factors on cryptocurrency dynamics. Highlights include a closer look at the Total Value Locked (TVL) growth across various chains, the impact of Ethereum's supply variations post-upgrade, and the impressive resilience displayed by certain cryptocurrencies like Helium and Tron amidst broader market corrections.
Our insights aim to equip stakeholders with the knowledge needed to make informed decisions in the fast-paced world of digital assets.
Crypto Market Capitalization in August
August started with a generalized market decline motivated by the Bank of Japan interest rate increase, prompting investors to unwind the “carry trade.”
In a span of a week, Bitcoin dropped 25%, the S&P 500 7.8% and the Nasdaq 100 declined by 10.6%.
From that dip until the end of the month, Bitcoin recovered by 18% and the crypto market cap increased, from bottom to top, an impressive 31%, indicating growing excitement around altcoins.
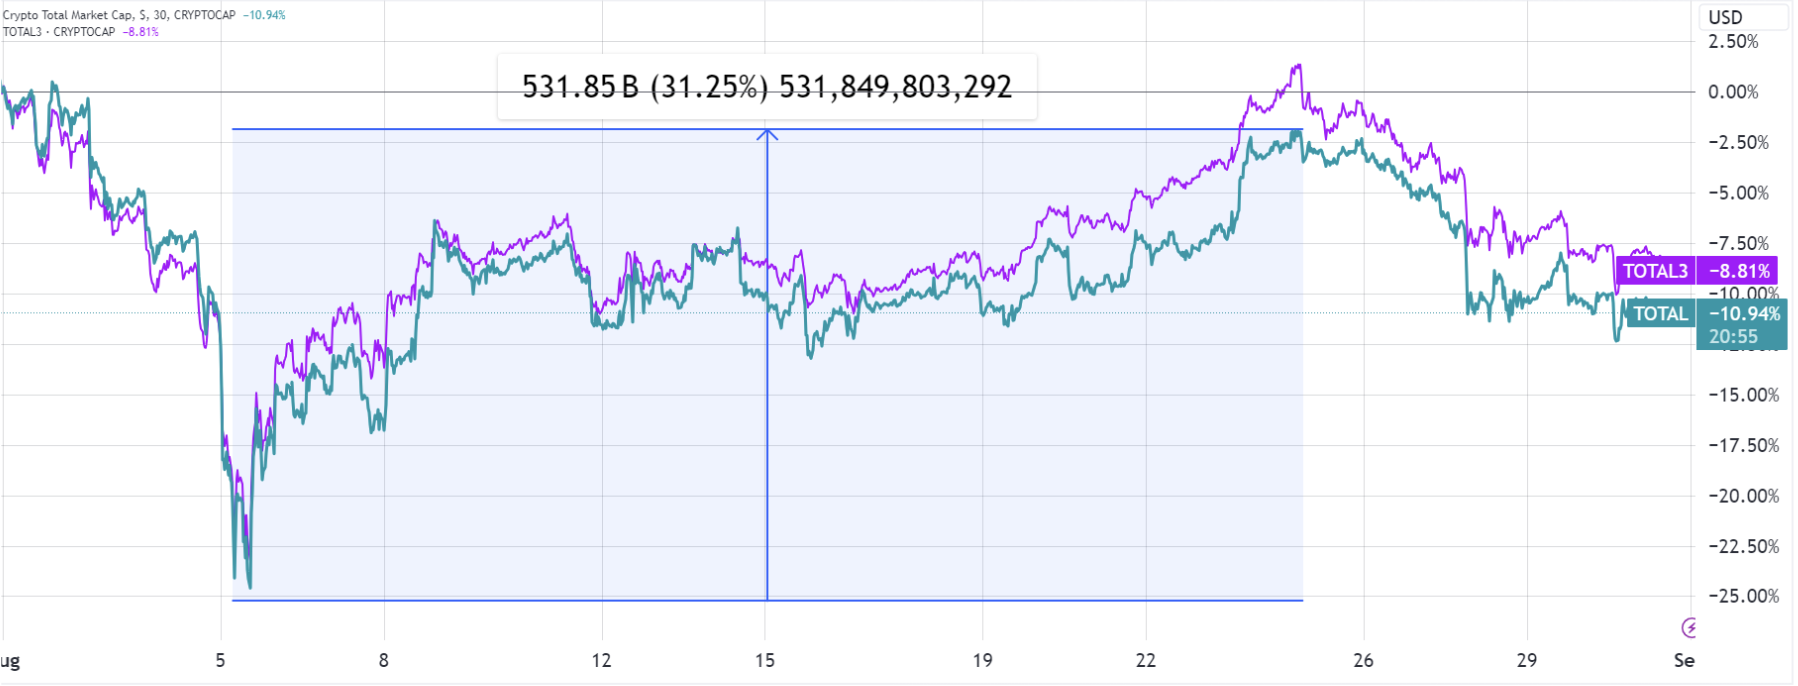
Despite the recovery, the total crypto market cap lost 10.9% MoM and the total market cap excluding Bitcoin and Ethereum lost 8.8%
The volatility observed in August highlights the interconnectedness between traditional financial markets and cryptocurrency. Investors react to macroeconomic factors, such as interest rate changes. This shows that it’s important to monitor the markets at the macro level. This month’s fluctuations serve as a reminder that while Bitcoin remains a dominant player, the rise of altcoins signals a diversification in investor interest.
Convergence of Futures and Spot Prices
While in April and for part of May/Jun/Jul the Bitcoin Perpetual future prices were trading in contango - i.e., showing market expectation of higher prices - they now trade in backwardation - i.e. the futures price is lower than the spot price, meaning that the market expects the prices to decrease.
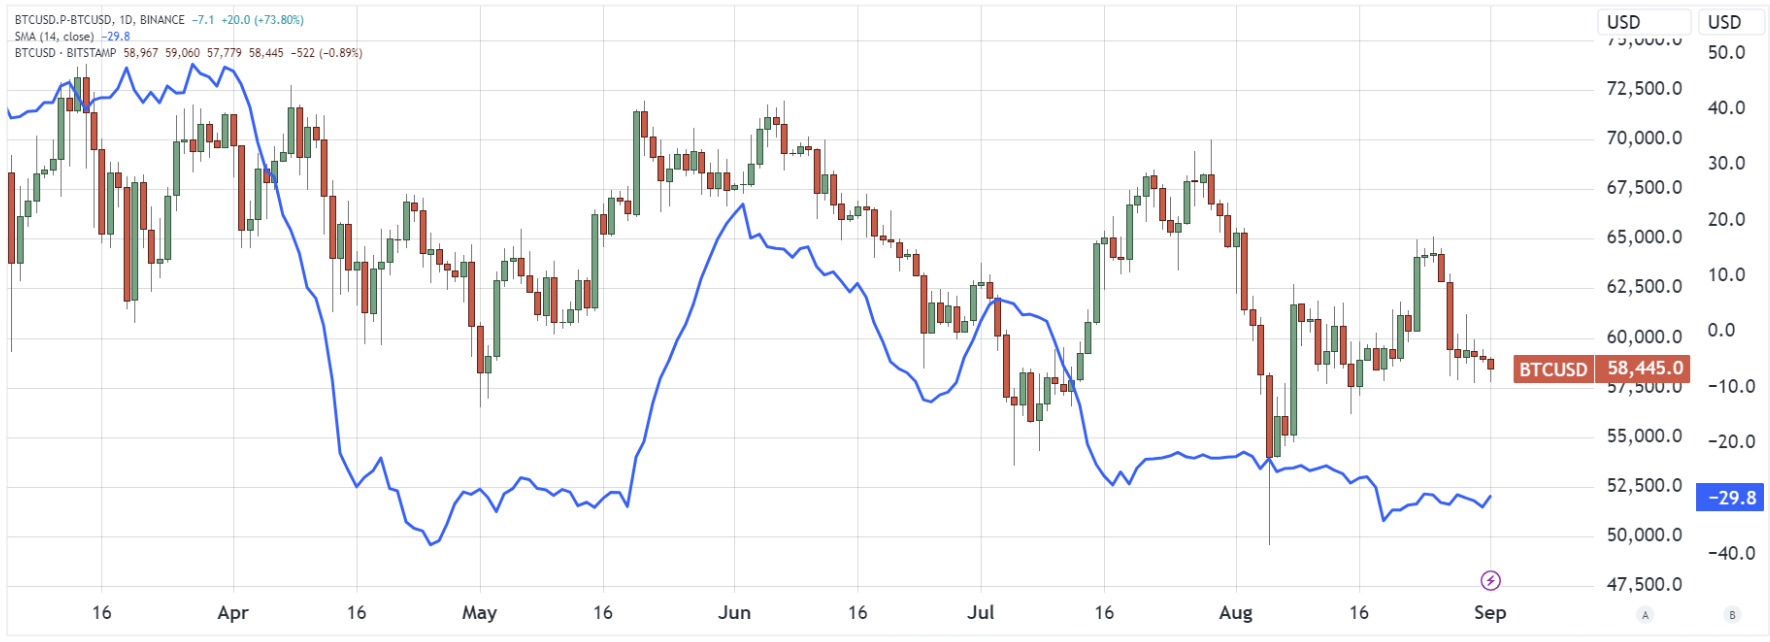
The decline of a positive divergence between futures prices and spot prices can be read as a bearish sign, but it might also simply be the result of lower liquidity in the market.
The shift from contango to backwardation can also reflect a shift in short-term market sentiment, as backwardation may suggest that market participants are anticipating short-term price declines.
Bitcoin - Social Media Activity and Retail
August was a mixed month in terms of Bitcoin market sentiment. While Bitcoin futures prices indicate a bearish sentiment, social media activity has been increasing, which is usually a good market sign.
Simultaneously, the number of Bitcoin retail users has increased to nearly 0.5%.
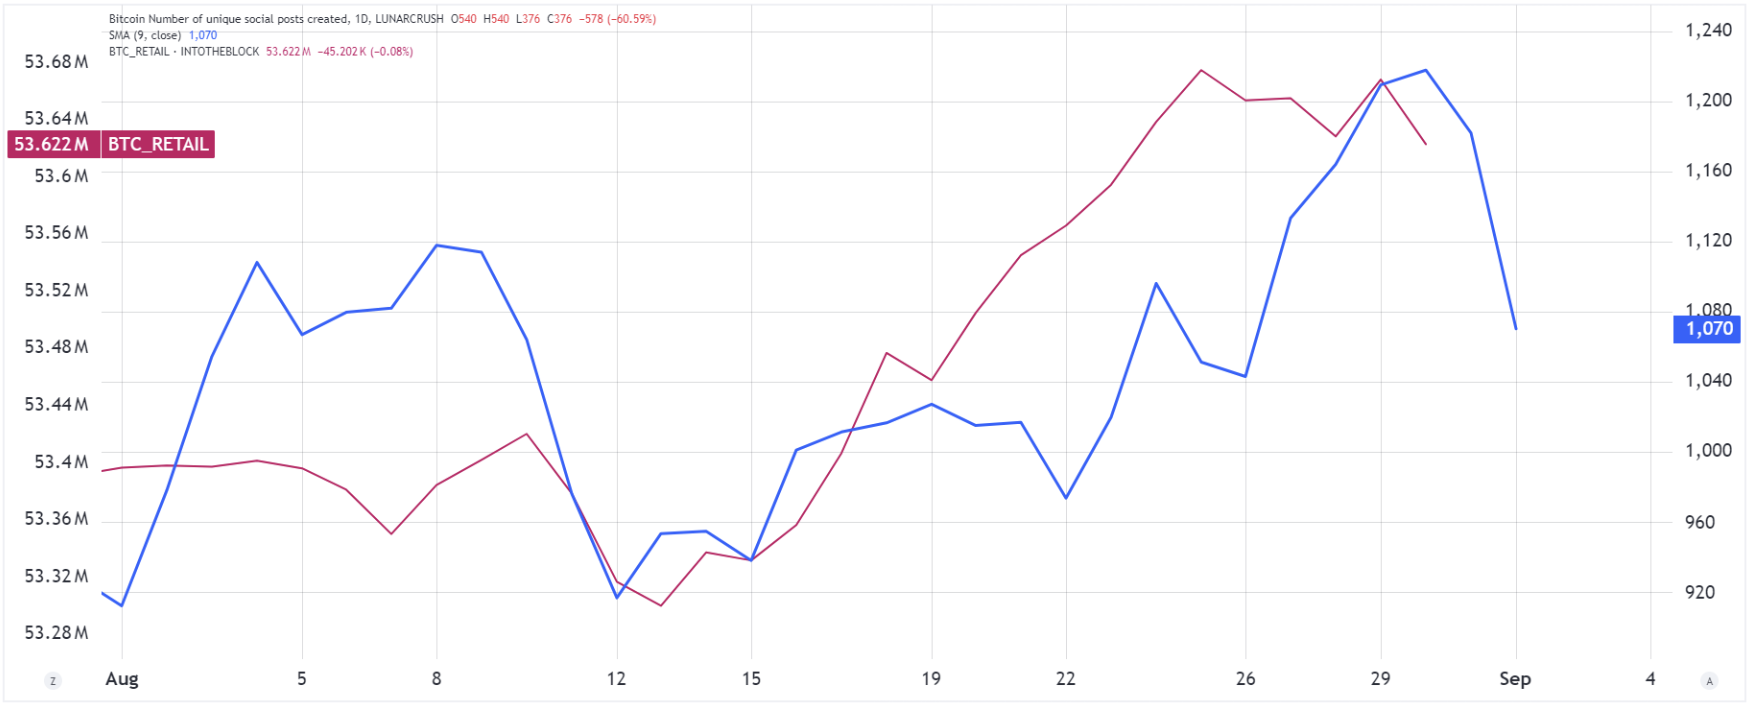
The contrast between bearish futures prices and rising social media activity could indicate a divergence in market sentiment. Increased social media engagement may reflect growing interest and optimism among retail investors, despite the bearish signals from futures markets.
Heightened social media activity often precedes price movements, potentially influencing market dynamics.
Moreover, the increase in Bitcoin retail users is a significant indicator of market health and counters other bearish indicators. A growing number of retail participants can enhance liquidity and support price stability, even amidst bearish trends. This trend suggests that retail investors remain resilient and engaged.
Sector Performance
Despite negative price action across the crypto market, three sectors showed positive performance: NFT applications, DePIN and Bridges.
The main contributors to the positive performance of these 3 sectors are:
APENFT (+12%) an NFT applications, Helium (+35%) a popular DePIN, and LayerZero (+9.5%) in the bridge space.
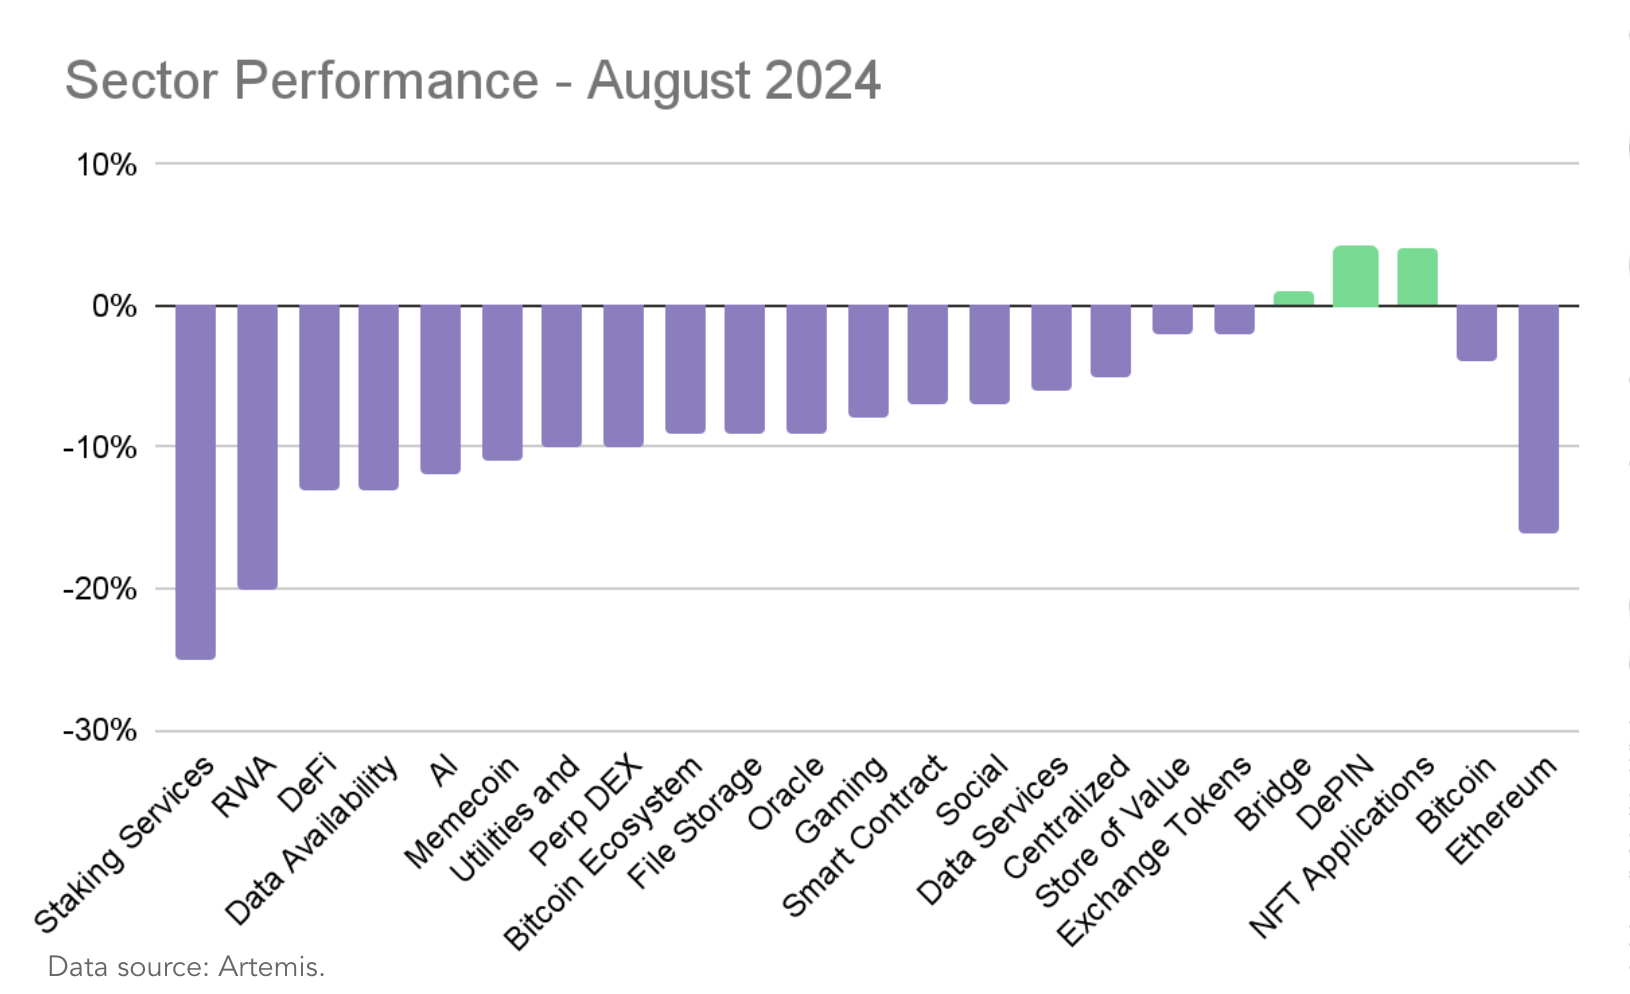
On the other hand, the sectors that suffered the most were liquid staking, with Lido tanking -35% and RWAs with Ondo and Mantra both declining by -21%.
August Leaders and Laggards
Bitcoin’s price declined -9% in August, while Ethereum declined by -21%.
Among the top 100 cryptocurrencies by market cap, only 14 had a positive performance in August.
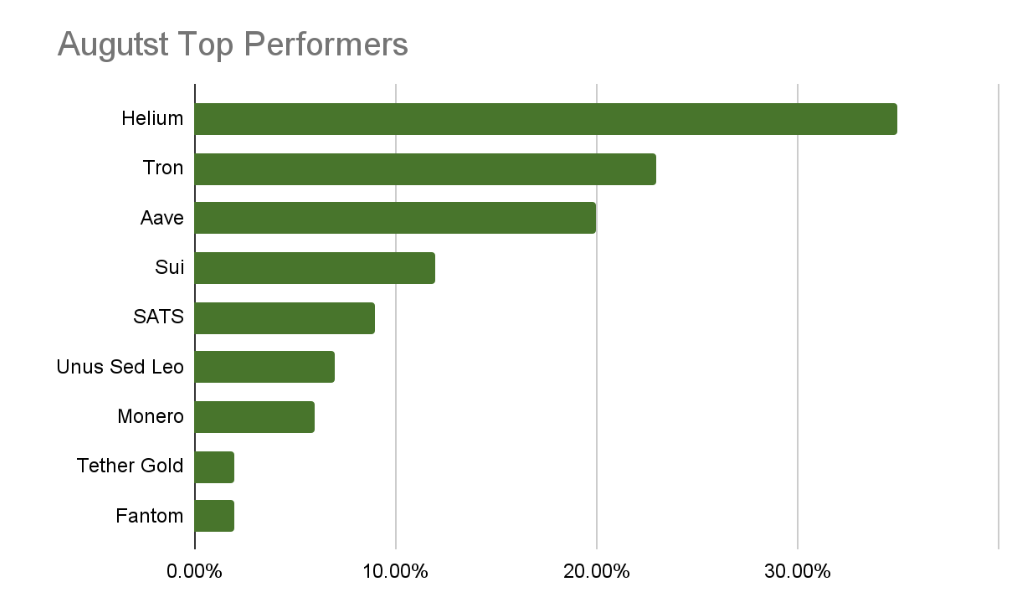
Among the top 100 market cap crypto assets, the best performers in August are:
Helium: 35%
Tron: 23%
Aave: 20%
Sui: 12%
SATS: 9%
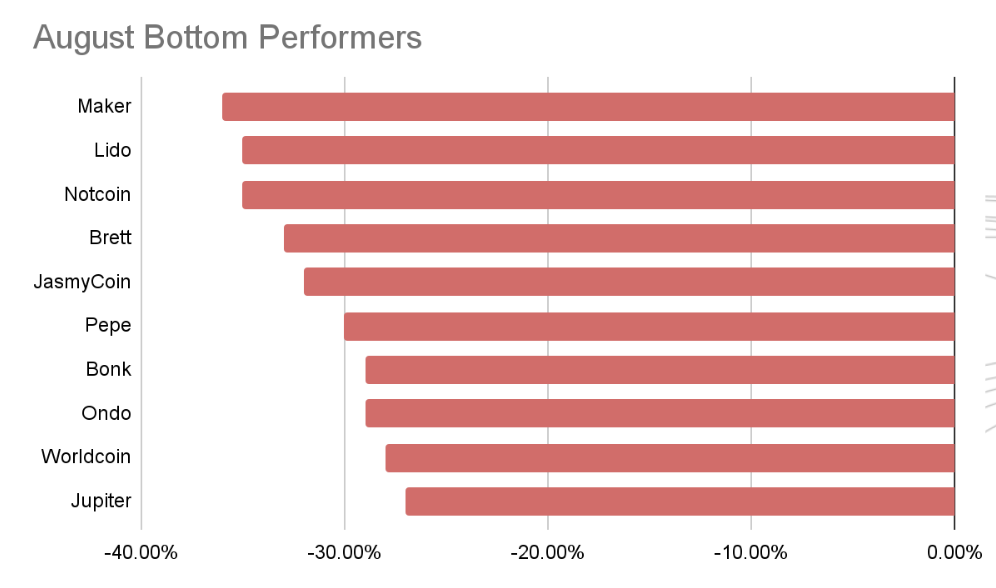
Among the top 100 market cap crypto assets, the worst performers in August are:
Maker: 36%
Lido: -35%
Notcoin: -35%
Brett: -33%
Jasmycoin: -32%
The significant Bitcoin and Ethereum declines reflect a broader market correction, and potential bearish sentiment among investors. However, the standout performances from assets such as Helium and Tron suggest pockets of resilience and investor interest in specific projects/sectors.
ETF Inflows
In August, the US spot Bitcoin ETF AUM declined from $58 billion to $53 billion. This 8.6% decline is reflecting the general bearish sentiment among institutions.
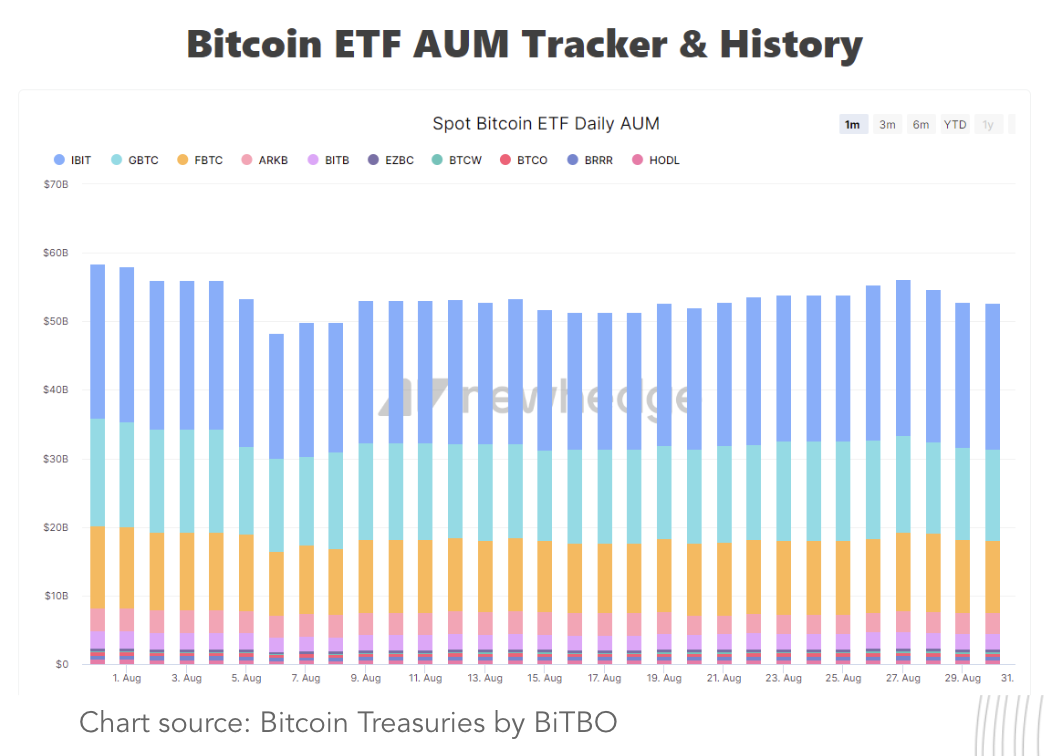
The decline in assets under management (AUM) in Bitcoin ETFs indicates a cautious approach from institutional investors amid market volatility.
However, financial institutions continue to push for the ETF market and we can foresee more ETF inflows in the future. For example, Franklin Templeton filed for a crypto index ETF in August.
On the other hand, August was a positive month in terms of ETF inflows for the Hong Kong ETFs, and the total AUM has crossed the HKD 2 billion mark.
Top spot Bitcoin ETFs in Hong Kong:
Price Trends and Technical Analysis
As the US elections approach and the FED prepares for rate cuts, the macro conditions are getting ready for a Bitcoin breakout.
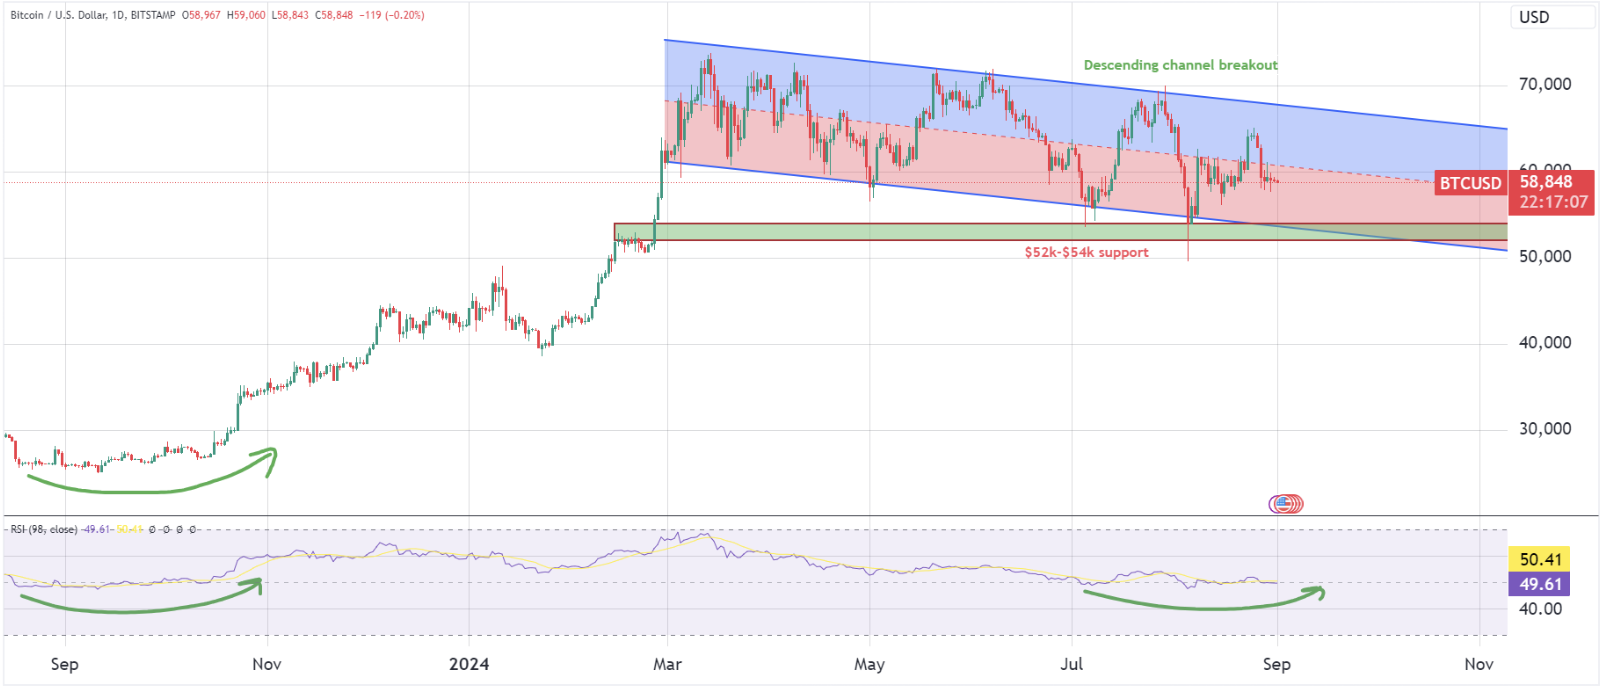
Here's the explanation for the TA above:
Descending Channel: Bitcoin has been trading within a downward channel, with lower lows and low trading volumes. However, there's potential for a bullish breakout if the price moves above the channel's upper resistance, which is around 65k.
Key Support at 52K-54K: This level has so far provided strong support, preventing further declines.
RSI Indicator: The RSI around 49 indicates a neutral momentum, but a potential upward movement can shift towards a bullish trend.
If Bitcoin breaks out of the descending channel and holds above 53K, it can trigger a significant upward move, and perhaps the start of a new bull run.
The current technical indicators suggest that Bitcoin is at a critical juncture. The descending channel reflects a period of consolidation, which often precedes a breakout. Investors should monitor key resistance levels closely, as surpassing $65K could indicate renewed bullish sentiment in the market.
The main oscillators and indicators analyzed - Bollinger Bands, RSI, CCI and MACD - all show a neutral momentum.
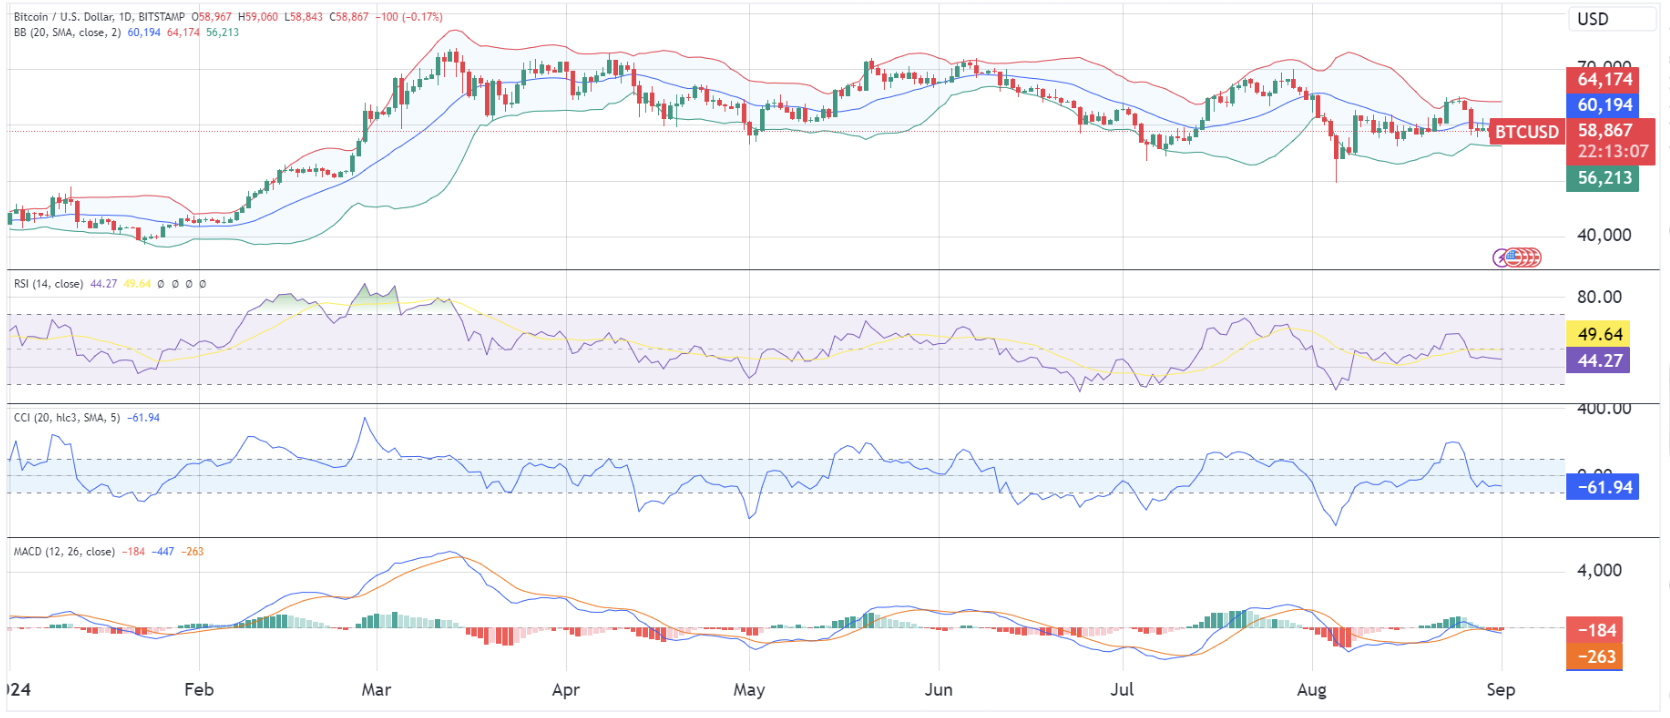
Bollinger bands: Neutral to oversold. Narrowing bands indicates lower volatility, which can precede a breakout.
RSI: Neutral to slightly oversold.
CCI: Neutral to oversold, suggests a potential reversal or bottoming out, but it might take time for the price to react.
MACD: Neutral/Bearish. bars are decreasing in height, which might indicate a potential weakening of the downtrend.
In the short term, Bitcoin appears to be in a bearish phase but is approaching potential reversal points.
Bitcoin Hashrate
The Bitcoin Hashrate - the primary indicator of computing power from miners on the network - has increased by 28% in July and August.
The hashrate is typically an indicator that precedes market movements and shows that key market participants - miners - are investing in computing resources to mine Bitcoin.
While the hashrate increased by 28%, during the same period, the BTC price diverged, declining by 5.6%.
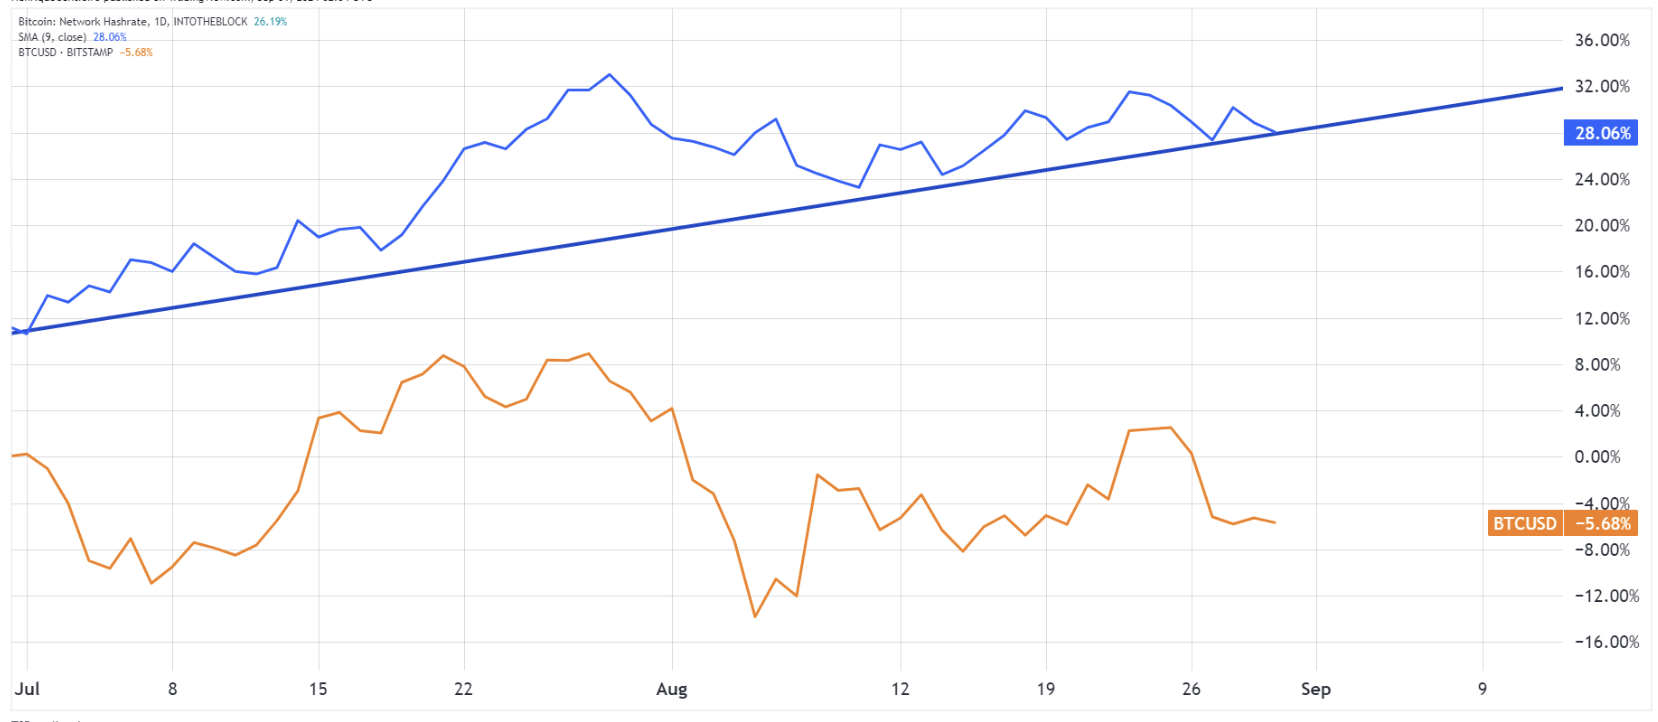
The 1-year correlation coefficient between the Bitcoin price and the Bitcoin mining hashrate is currently 78%, meaning that there’s a strong likelihood that the two will converge.
The divergence between the hashrate and Bitcoin price raises questions about the market dynamics. An increase in hashrate signals confidence among miners about future profitability, yet a declining price may indicate broader market concerns or external factors influencing investor sentiment.
Spot Volumes
August spot volumes for Bitcoin and Ethereum experienced a slight decline.
Daily average spot volumes:
Bitcoin: $10.6 billion (down 2% MoM)
Ethereum: $6.7 billion (down 5.6% MoM)

Despite the stagnant volume in August, the North America market has been seeing an increase in trading volumes, and August was in fact the second best month of the year, with American exchanges registering a total volume of $165 billion.
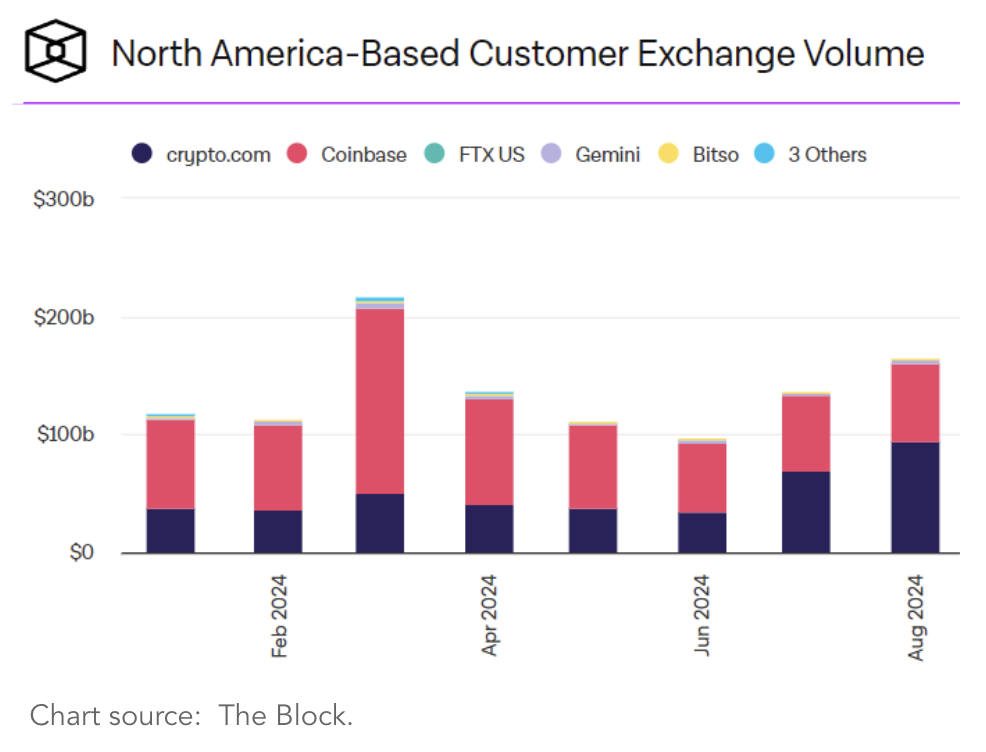
The decline in spot volumes for Bitcoin and Ethereum may reflect broader market trends or investor sentiment. However, the increase in North American trading volumes suggests that regional markets can exhibit resilience, driven by localized factors, for instance, speculation around the US elections.
Ethereum Supply Variation - A New Paradigm
From the Merge upgrade in September 2022 until the Dencun upgrade in March 2024, Ethereum operated primarily in a deflationary mode.
This was due to the fact that the Ethereum fee burning mechanism (EIP-1559) outpassed the Ethereum mining inflation.
However, since the Dencun upgrade, Layer 2s pay lower fees to the Ethereum chain, thus generating a lower burn rate on Ethereum. Although this improves the user experience, it is also a new paradigm for the supply/demand of ETH.
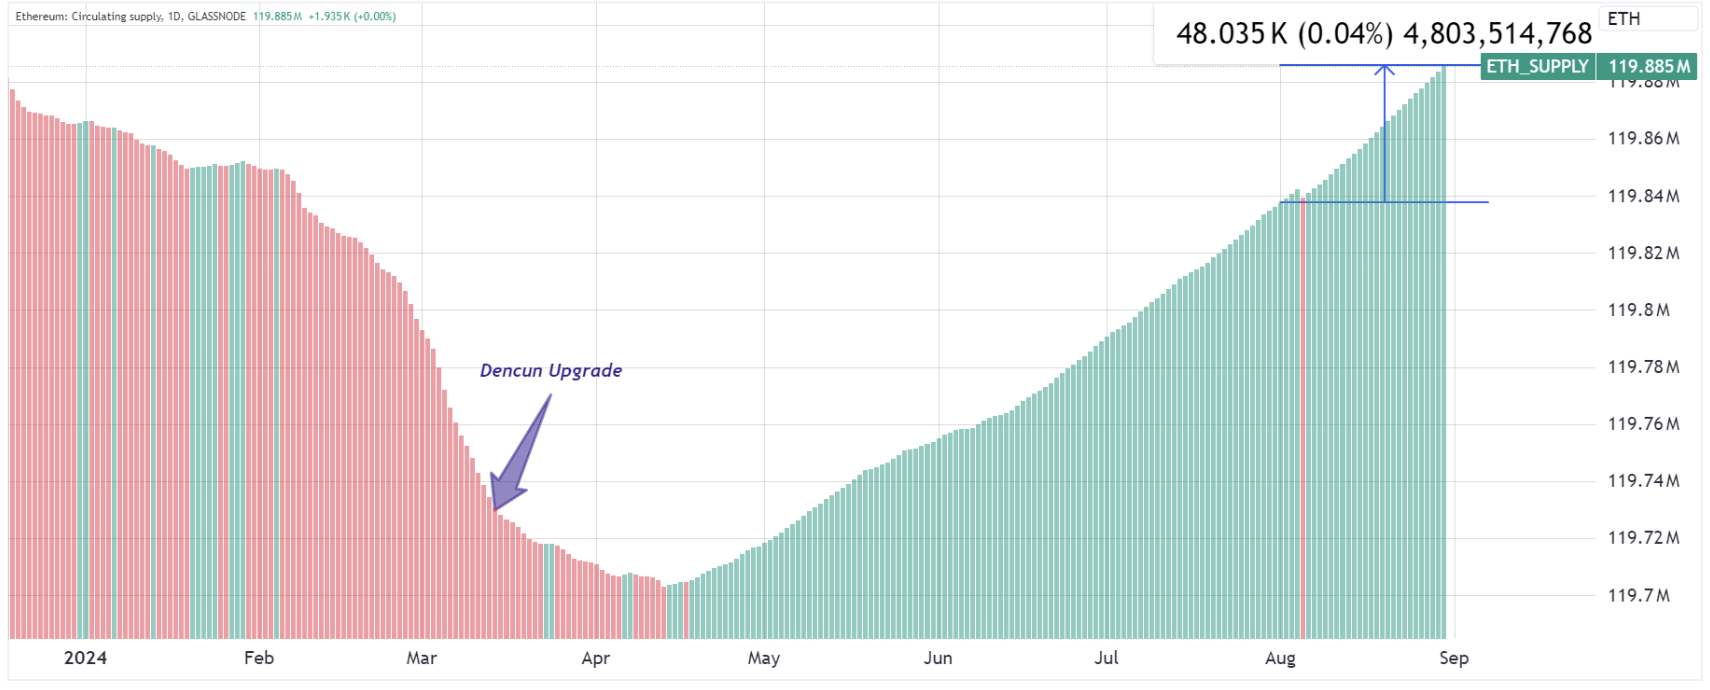
Over the last month alone, the Ethereum supply increased by 48k Ethereum, which is a supply increase of approximately $120 million worth of ETH.
This needs to be had into consideration in supply/demand pricing models that, until recently, assumed that ETH would always be deplationary in the future.
As Layer 2 solutions continue to evolve and gain adoption, the long-term impact on Ethereum's supply dynamics will be a key factor to monitor, influencing both market sentiment and long-term valuation models.
L2 Activity
We have seen a significant increase on Ethereum Layer-2 activity over the last 3 months, including in August. This increase in L2 activity shows that the crypto use cases are strong and that users are sticky.
Layer-3 activity is also one of the contributors to the scalability factor.
The charts below show the top and bottom chains in terms of user activity (transaction count).

The chart below shows how Layer-2 chains contribute to the scalability of the Ethereum ecosystem. In August, Layer-2 chains processed on average 29 times the throughput capacity of Ethereum (which is 11.7 transactions per second). In other words, Layer-2s are processing on average 340 transactions per second.
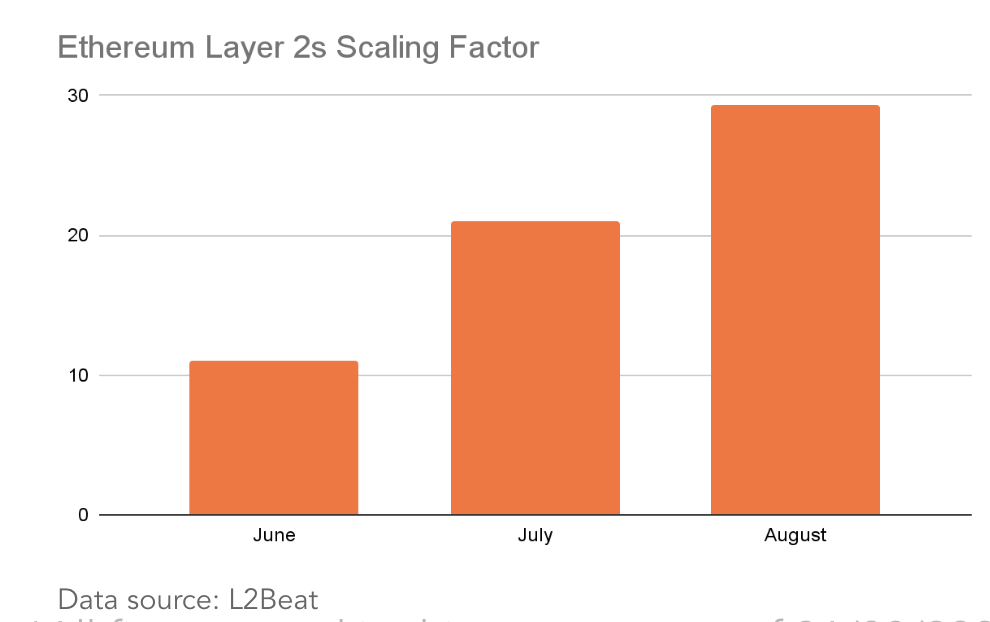
The rise in Layer-2 activity signals a growing acceptance and integration of blockchain solutions in various applications.
Showing appetite for blockchain technology too, Sony launched Soneium Blockchain, an Ethereum Layer-2.
TVL Growth Adjusted to Token Price
The chart below shows the TVL - Total Value Locked - adjusted by native token for different chains. This allows us to track the TVL growth normalized to price appreciation, isolating how much the TVL comes from net new inflows rather than price appreciation.
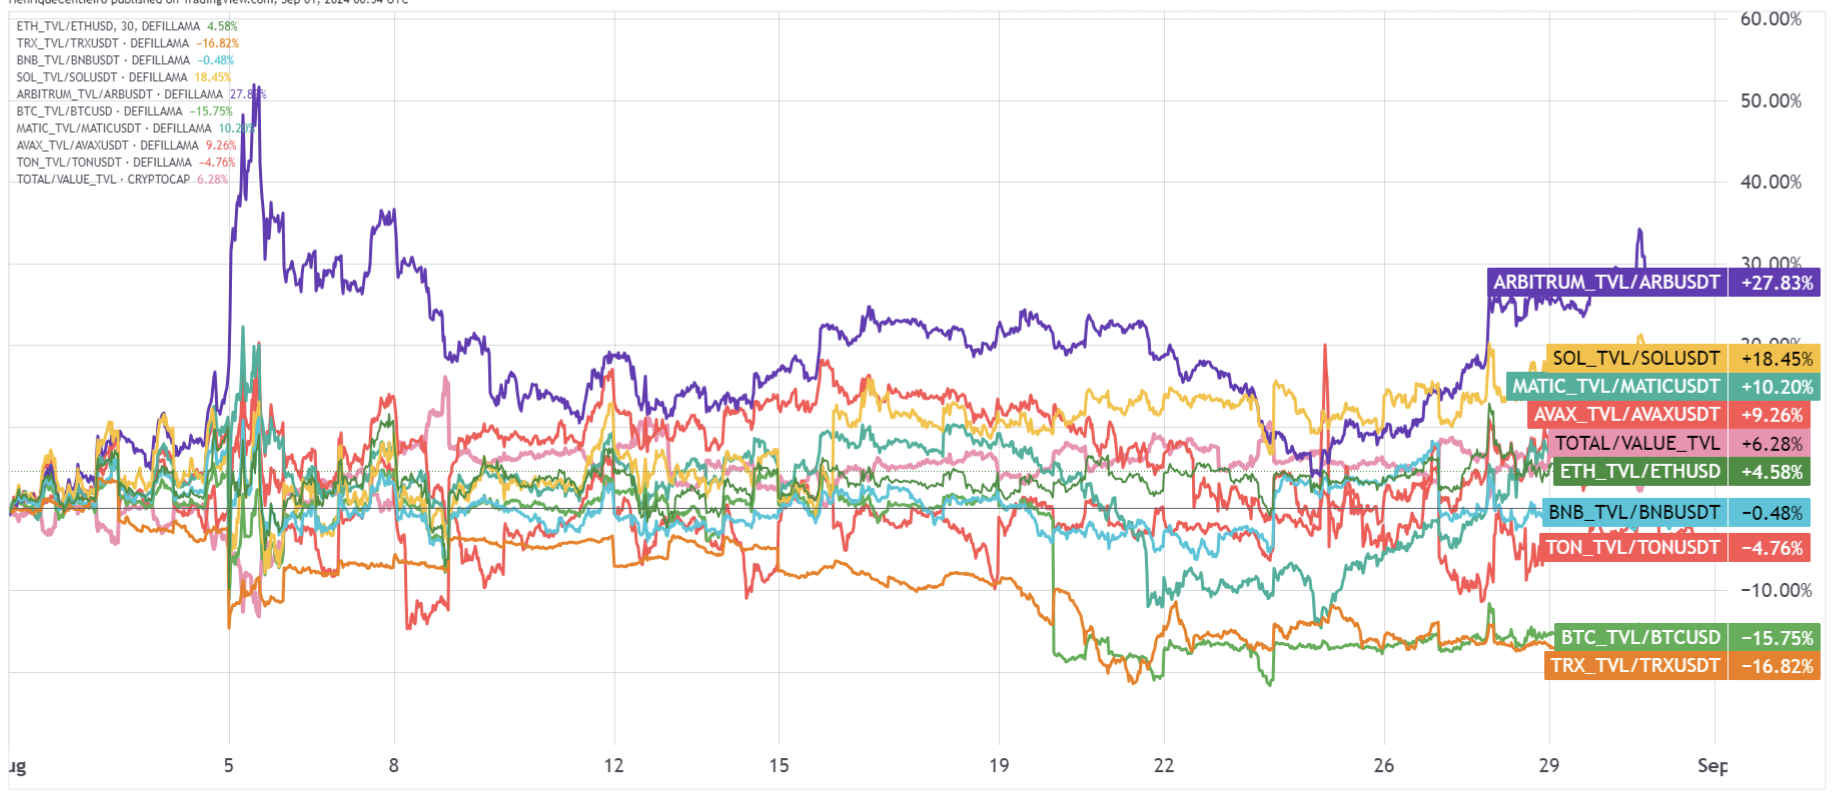
In August, TVL growth outpaced the total market cap growth by 6.28%. This is a great indicator that the usage and inflows into different chains are outpacing the prices. This is generally seen as a bullish sign that precede an increase in prices. If the chain token price lost value but the TVL adjusted to token price increased, it means that fundamentally, users keep using or even increased the usage of DeFi protocols within that chain. Arbitrum is a good illustration of this.
3-month TVL adjusted by native token price for the chains analyzed:

DeFi Activity
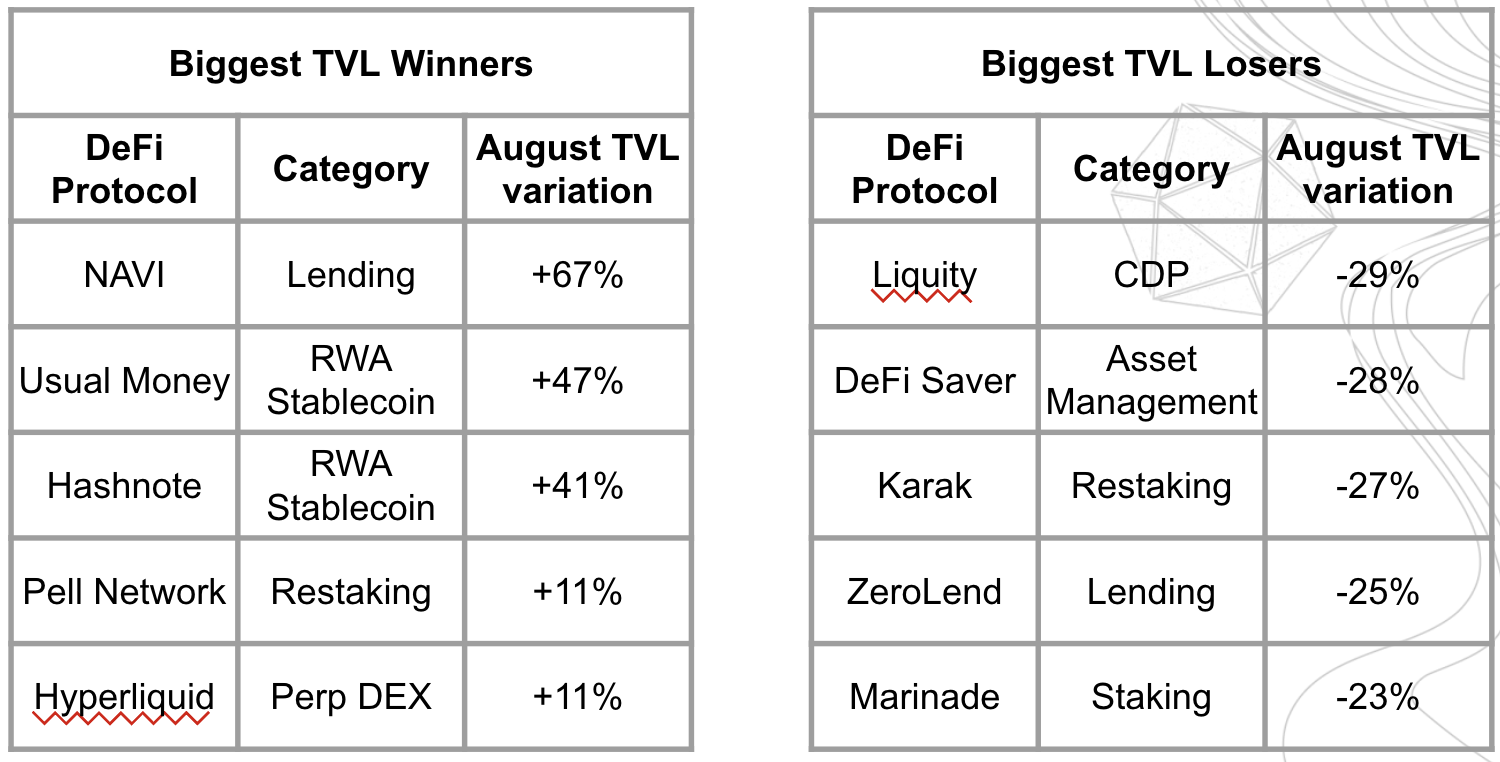
In August, the DeFi TVL declined by 16% from $98 billion to $82 billion. The categories that lost most TVL were:
Lending: -$4.1 billion
DEXes: -$3.4 billion
Restaking: -$4.4 billion
The notable performance of certain protocols highlights that despite the “not so good” market sentiment, there are still good ROI investment opportunities in the DeFi space.

The Month Ahead
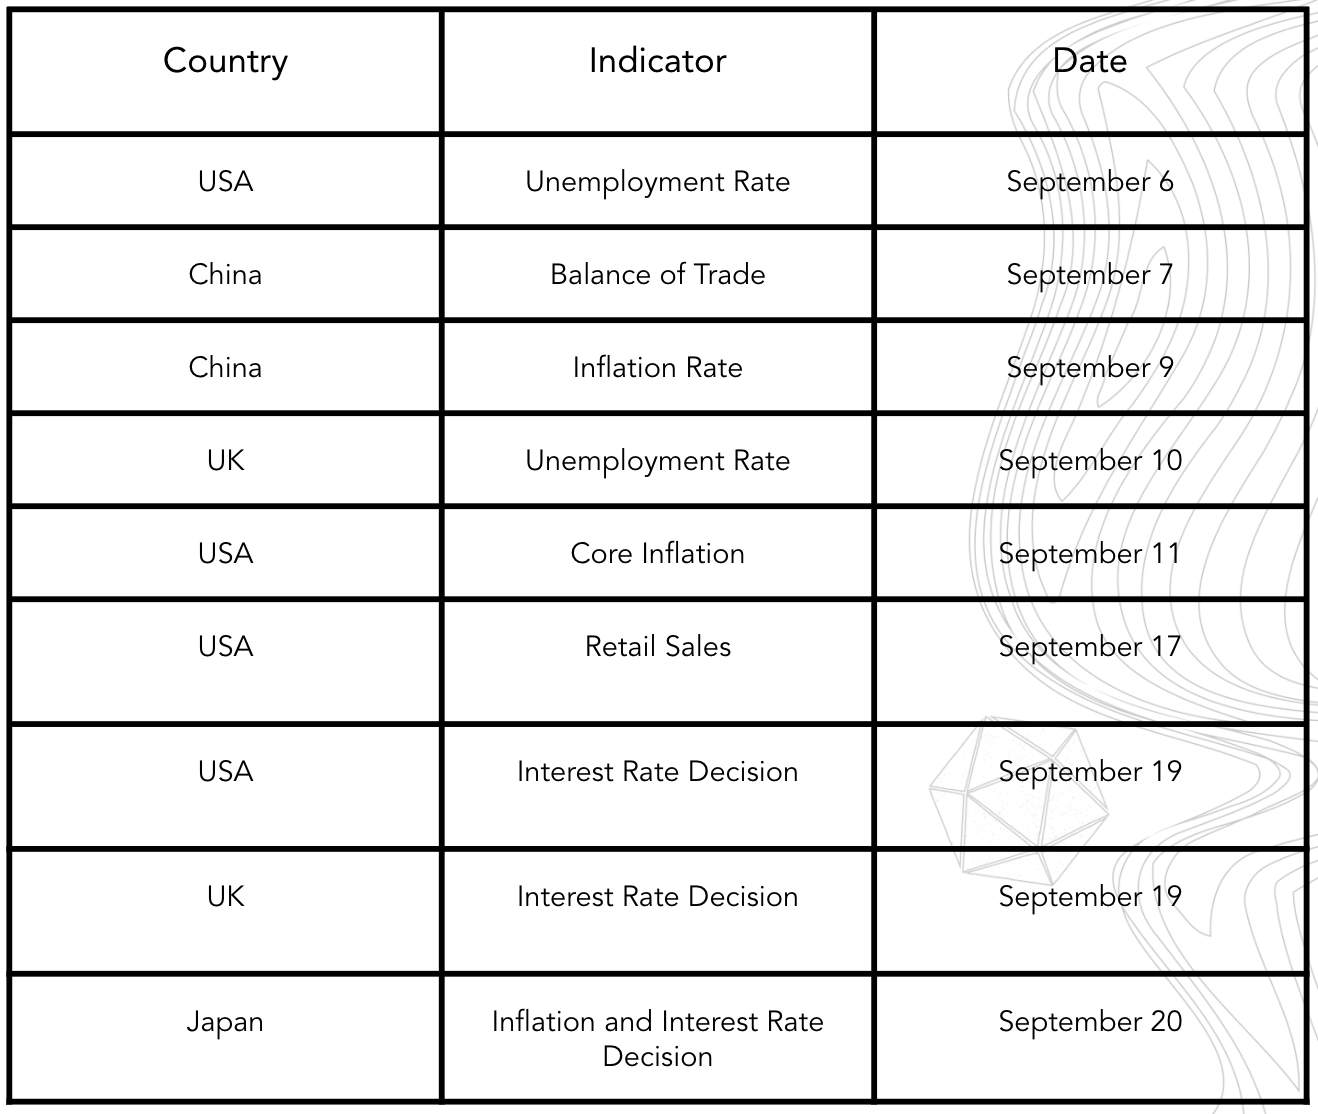
Here are the leading macro indicators and announcements for the month of September, 2024. These indicators will provide key insights into economic conditions and trends across major economies, influencing market sentiment and investment decisions.
