Why We Are Bullish on Altcoins
 HASHKEY CAPITAL
Reading Time: 21.19Min
Written by Jupiter Zheng, Xu Han and Vivien Wong
Recent crypto market updates
Market sentiment was generally bearish for altcoins in Q3, with Bitcoin dominance rising to around 54%, its highest level since April 2021. The Altcoin Season Index currently reads 37, after hitting its lowest point in mid-August.
HashKey Top 20 token index and theme indices underperformed BTC in Q3, this underperformance can be attributed to ongoing concerns about a potential US economic recession, external shocks such as the German Government and Mt Gox selloffs, the unwinding of the Japanese Yen carry trade, and a lack of significant sectoral development within the web3 industry.
Figure 1:YTD performance of different Crypto sectors

Source:HashKey Capital
Figure 2: Altcoin Season Index
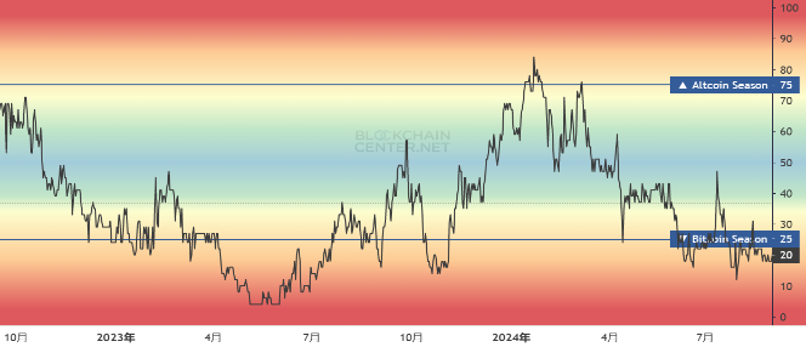
Source:Blcokchaincenter.com
Despite a market recovery in late Q3, Layer 1 was the only sector to record a positive return and outperform Bitcoin during the third quarter, according to Dune’s sector categorization. Investor interest has shifted away from DeFi and DePIN toward AI and meme tokens over the past quarter.
This shift contributed to poor performance in DeFi and infrastructure-related tokens, with the LRT sector down 15.77% and service infrastructure declining by 18.09%.
Figure 3: 90D Relative Strength of Crypto Narrative/Sectors


Source:Dune Analytics
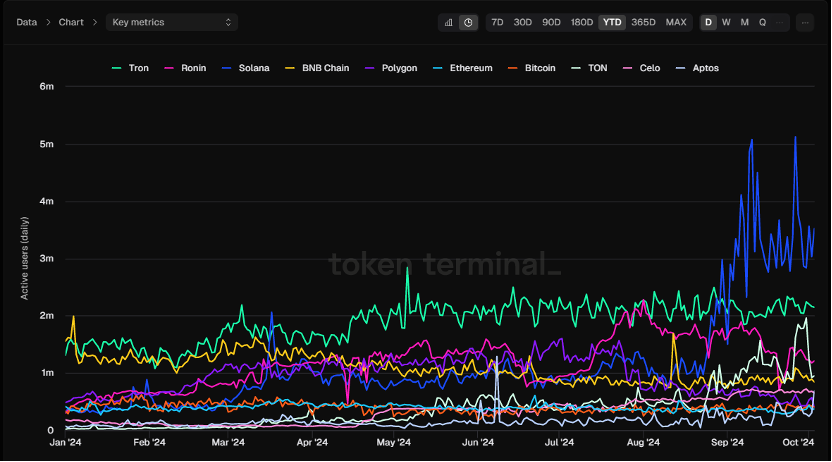
L1 smart contract platforms. Despite Ethereum remaining the sector leader in terms of the most applications, highest number of developers, and the largest total locked value (TVL), its market position is being challenged by several alternatives, including Solana, Tron, Ton, and the newly emerged Sui. These platforms compete by offering lower fees and targeting more users, which has resulted in a decline in Ethereum’s fee market share.
Figure 4: active users for major L1 protocols
Source:Token Terminal
The Dencun upgrade in March led to a substantial drop in Ethereum Layer 2 fees. Coupled with increased competition from other Layer 1 platforms, this caused a decline in transaction fees on Ethereum. As a result, Ethereum’s deflationary status,has been challenged, raising doubts about the “ultrasound money” narrative of ETH.
Despite these challenges, adoption trends in the Ethereum ecosystem remain strong, with 80% of tokenized assets still residing on its network. Furthermore, major companies like Sony have announced plans to build their blockchain projects on Ethereum.
Decentralized Physical Infrastructure Networks (DePIN) gained traction in early 2024, boosted by Solana’s role in DePIN apps and the AI-crypto convergence. Node sales helped bootstrap communities and drive revenue. However, by Q3, the sector’s momentum slowed due to bearish sentiment in the broader crypto market and doubts about real-world applications and business sustainability. Enthusiasm for DePIN assets has since cooled.
AI: The growing demand for AI, driven by OpenAI’s ChatGPT, has increased the need for storage, computing, and network resources. Centralized AI infrastructure faces challenges like high entry barriers and data control issues. Blockchain, with token incentives, offers a solution by fostering user and community engagement. Bittensor (TAO) leads with its decentralized machine learning platform, while Fetch.ai (FET) stands out for optimizing transportation and supply chains with AI and autonomous agents.
RWA: The involvement of traditional finance (TradFi) is driving the growth of tokenized assets. Recent developments include Mantra’s $500M real estate tokenization, BlackRock’s BUIDL fund surpassing $500M, and investments in Securitize and Ironlight. WisdomTree has also expanded with its WisdomTree Connect platform, offering tokenized funds. Avalanche (AVAX) focuses on compliance and security, partnering with Citi and JPMorgan for on-chain RWA solutions, while Ondo Finance (ONDO) offers DeFi users tokenized access to U.S. Treasuries. As regulations solidify, more projects offering diverse tokenized securities are expected to emerge, appealing to a wider range of investors.
DeFi: DeFi has made notable advancements, providing enhanced scalability and clearer use cases. Over various market cycles, DeFi has demonstrated its capacity to attract capital through competitive yield opportunities. Prominent DeFi projects from previous cycles, such as AAVE (2020), LIDO (2020), MakerDAO (2017), and Chainlink (2017), have become integral components of the ecosystem’s infrastructure.
Several DeFi protocols are expanding across multiple blockchain networks, with leading projects solidifying their positions. For instance, AAVE is now deployed across 13 chains, highlighting its cross-chain presence. AAVE’s TVL stands at $12 billion, approximately two-thirds of its 2021 peak of $19 billion. Whereas Ethereum’s TVL is currently at $49 billion, around half of its previous peak of $108.9 billion.
Newer protocols such as EigenLayer ($10.8 billion) and Lido ($23.5 billion) have gained prominence, despite not being part of the 2021 DeFi landscape. In particular, EigenLayer has garnered significant attention this year, with ecosystem projects like Ether.Fi, Pendle, and Renzo capitalizing on the growing interest in restaking, securing considerable market share. However, restaking initiatives have cooled in Q3 due to yield saturation and unsustainable reward models.
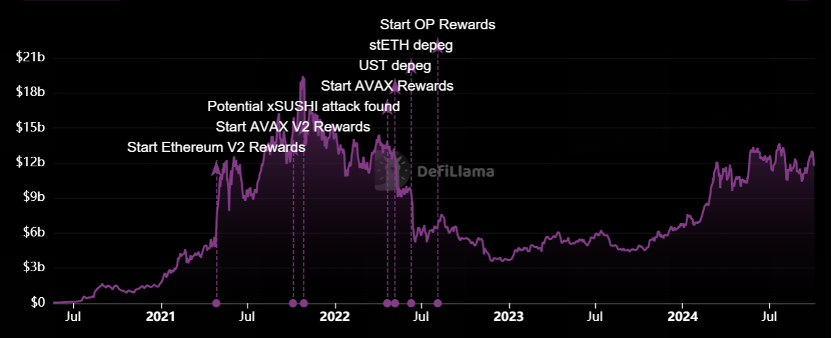
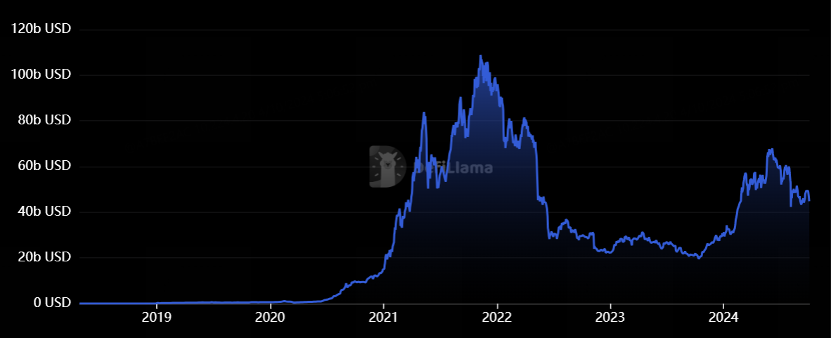
Figure 5: LTV for major DeFi protocols
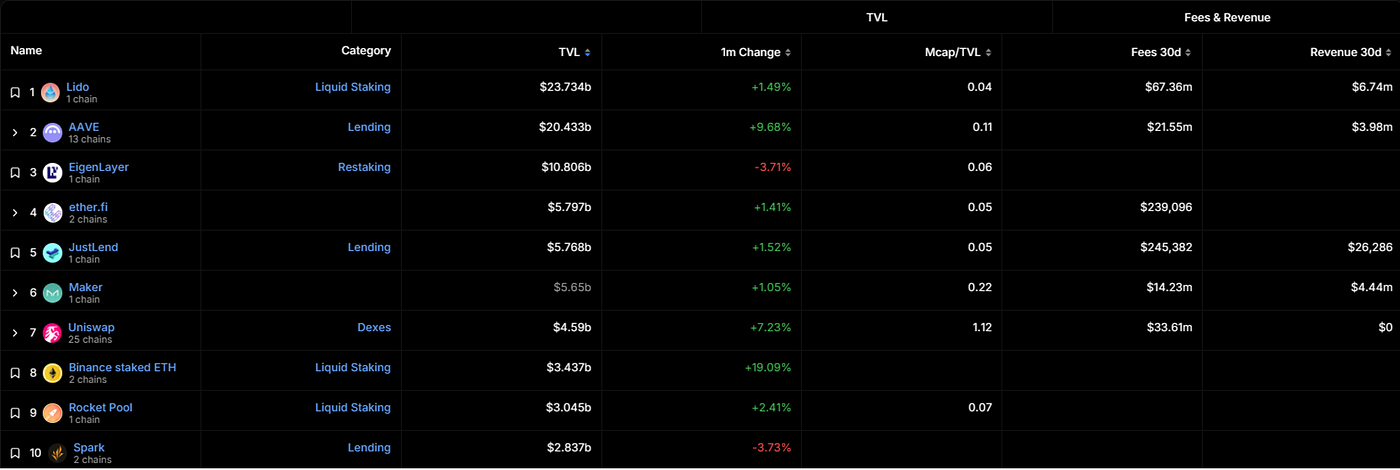
Source:Defillama
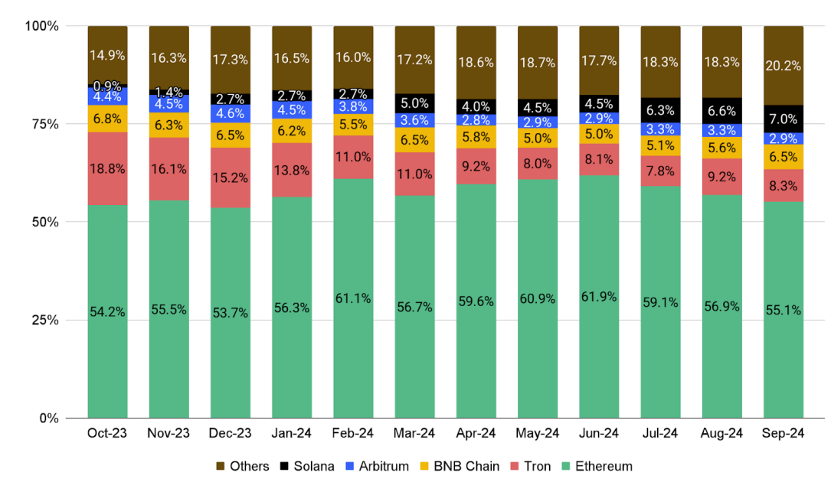
From a blockchain perspective, Ethereum maintains its lead in Total Value Locked (TVL) follow by Tron, but capital inflows into DeFi markets have been driven particularly by TVL gains in Scroll and Sui.
Figure 6: TVL share of top blockchains
Source:Defillama and Binance
Gaming and Entertainment. In the third quarter, the market value of Web3 gaming dropped by 8%. Despite this, Web3 games remain a strong player, accounting for 30% of all dApp activity, with 2.1 million daily active wallets. New game releases are expected to positively impact the market in the future. The Ronin and TON ecosystems lead the Web3 gaming sector.
Ronin benefits from the success of Axie Infinity, while TON offers seamless integration with Telegram, making it accessible to 900 million users. Some TON mini-games, including titles like Notcoin, Catizen, and Hamster Kombat, has become notable hits.
Cryptocurrency will benefit from global monetary easing cycle
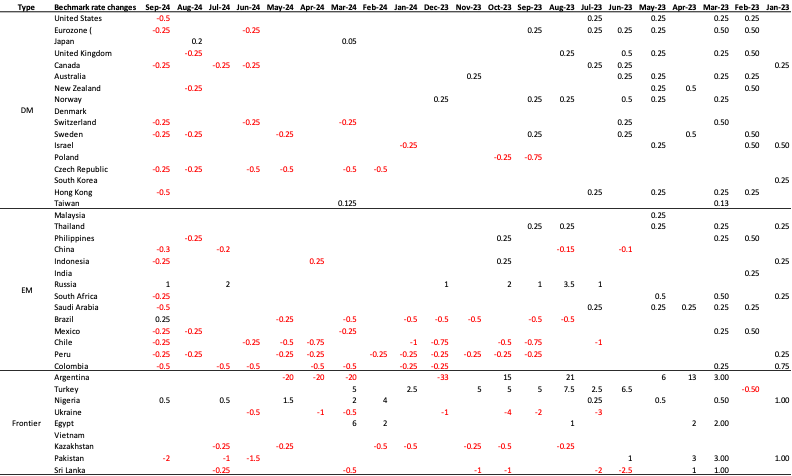
Global economies are in the midst of a monetary easing cycle. Major emerging market (EM) nations initiated interest rate cuts as early as the second half of 2023. Meanwhile, most developed market (DM) nations began their rate-cutting cycles in the second half of 2024, with the exception of Japan.
According to the latest OIS pricing, the market expects the Federal Reserve to lower its benchmark interest rate by over 160 basis points, to approximately 3.20% by the end of 2025. Similar expectations exist for the Bank of England (BOE), European Central Bank (ECB), Reserve Bank of Canada (RBC), and Bank of Canada (BOC), with rates expected to decrease by around 100 to 200 basis points during this easing cycle.
Figure 7: Benchmark interest rate movement for major economies
Source: Bloomberg
The U.S. real interest rate is a key factor in pricing major real assets, including gold and cryptocurrencies. Historically, there has been a strong correlation between the developed DM interest rate cycle and the U.S. real interest rate.
However, real rates remain elevated due to ongoing quantitative tightening (QT) by major DM central banks. It is expected that the Federal Reserve and European Central Bank (ECB) will conclude their QT programs by the first half of 2025, or possibly earlier if recessionary pressures intensify.
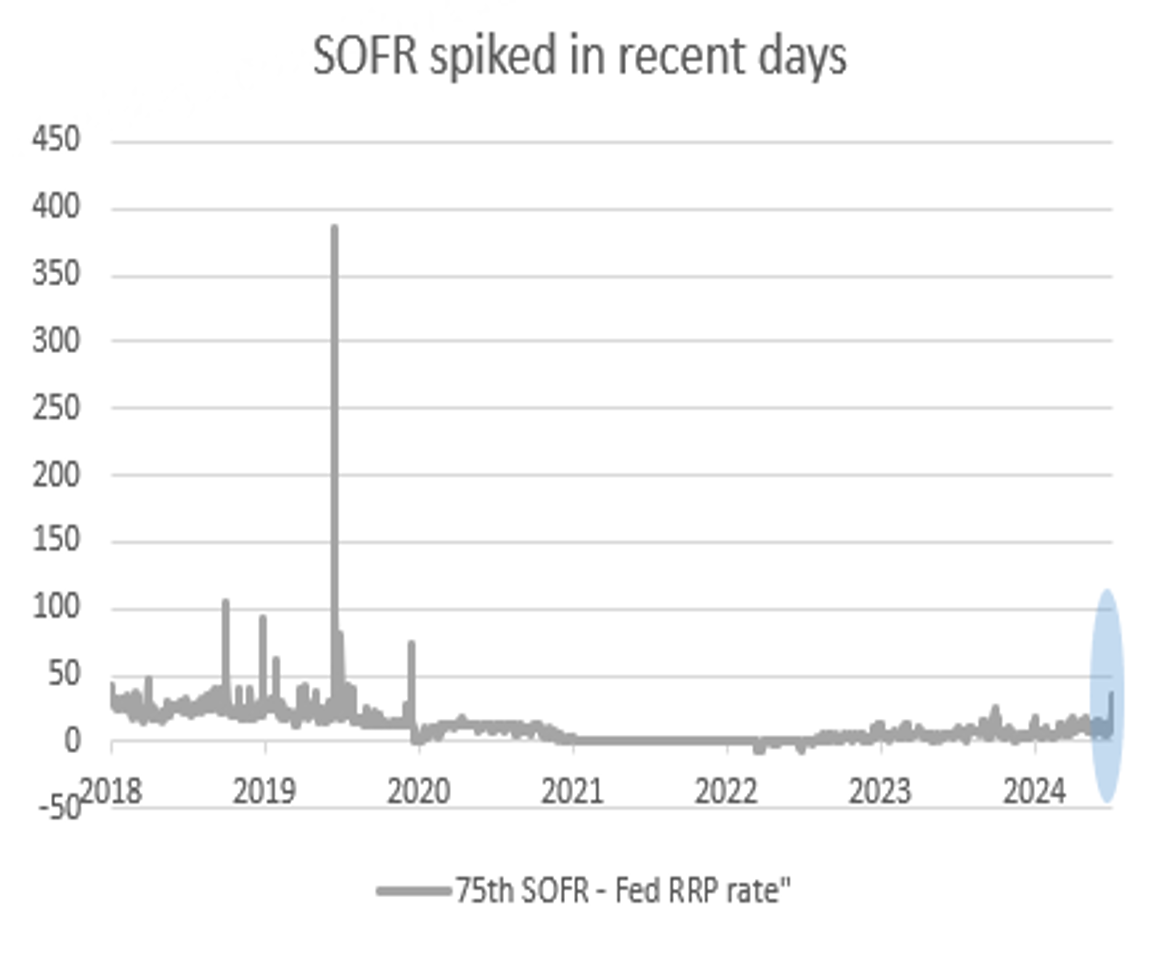
Recently, increased pressure has been observed in the U.S. repo market, with SOFR spiking at the quarter’s end. This situation mirrors the 2019 repo market crisis, which prompted the Federal Reserve to abruptly stop its balance sheet reduction. The end of QT will likely trigger a significant decline in U.S. real yields, which would benefit the cryptocurrency sector.
Figure 8. Major central banks balance sheet % GDP
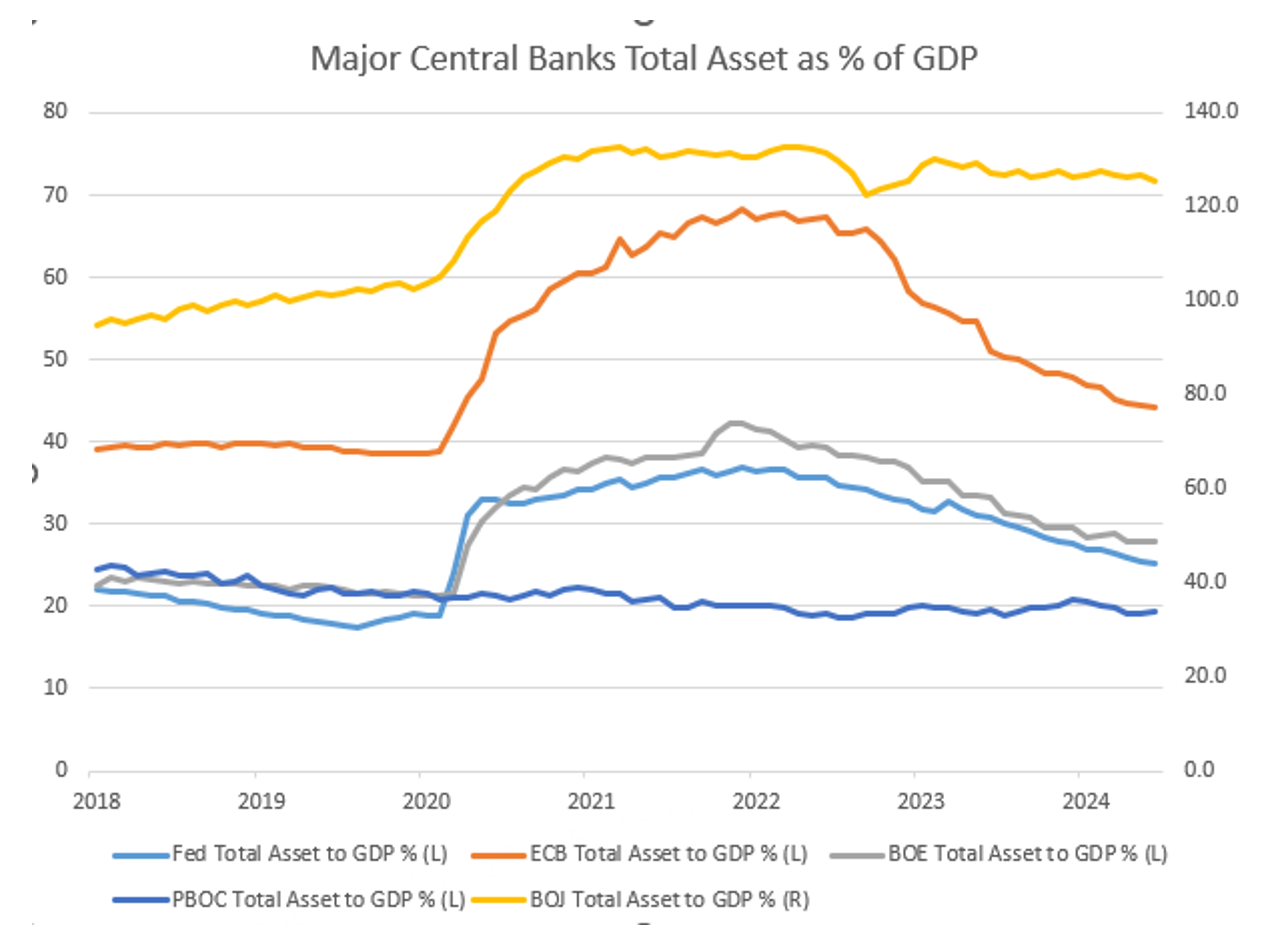
Figure 9. SOFR spike reminds us of the 2019 repo crisis
Source: Bloomberg
Figure 10. Cumulative number of rates cut from major DM central banks vs 10y US real yield
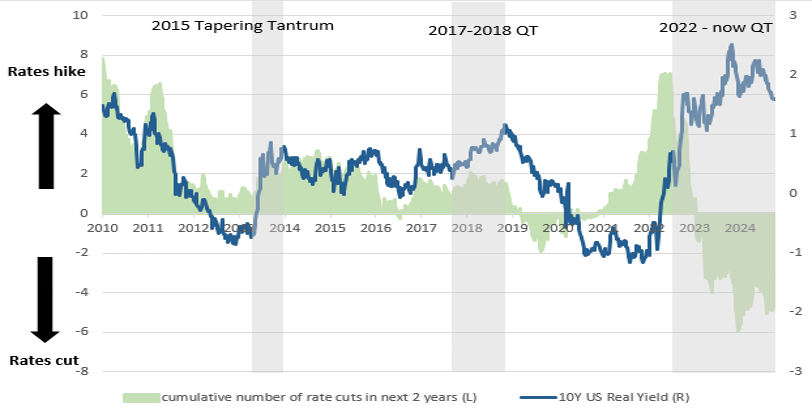
Note: cumulative number of rates cut pricing from OIS futures for Fed, ECB, BOE, BOC, RBA and BOJ combined weighted by the size of central bank balance sheet.
Source: Bloomberg.
Figure 11: relationship between real yield and crypto assets

Source: Bloomberg
With ample room for further interest rate cuts during the current easing cycle and the potential for QT to end as early as the year’s close, we could witness a dual effect of rising credit demand and an expansion of the monetary base. These factors are expected to drive the global liquidity cycle into a new upward trajectory.
Cryptocurrencies’ correlation with global liquidity is high. Here, we define global liquidity as the aggregate M2 supply from major economies, as specified by BGeometrics. We examined how closely BTC and ETH price tracked global liquidity over time using loglinear regression analysis as below.
Figure 12: relationship between global money supply and crypto assets

Source: Bloomberg, BGeometrics
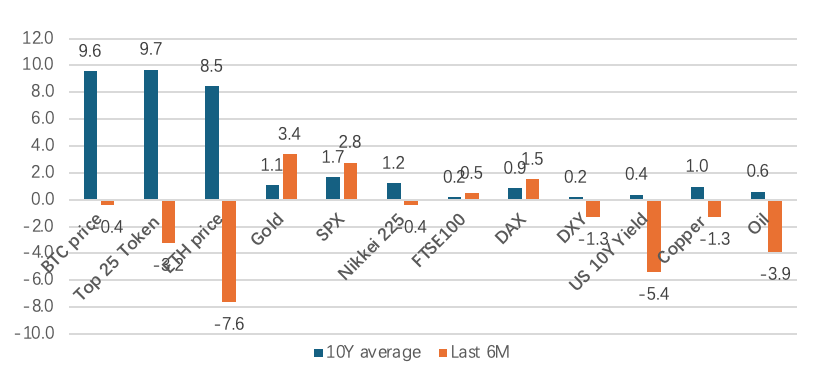
Examining the beta factor of major asset classes against the global liquidity index over a 10-year period and a shorter 6-month period, historical data shows that cryptocurrencies are the most sensitive to changes in global liquidity, with asset betas exceeding 8.5 for various crypto assets.
However, the sensitivity factor turned negative over the past 6 months. We believe these short-term deviations were caused by idiosyncratic shocks such as government selling and previously inflated valuations.
Figure 12: Asset Beta to 1% increase in Global Money Supply
Source: Bloomberg, BGeometrics
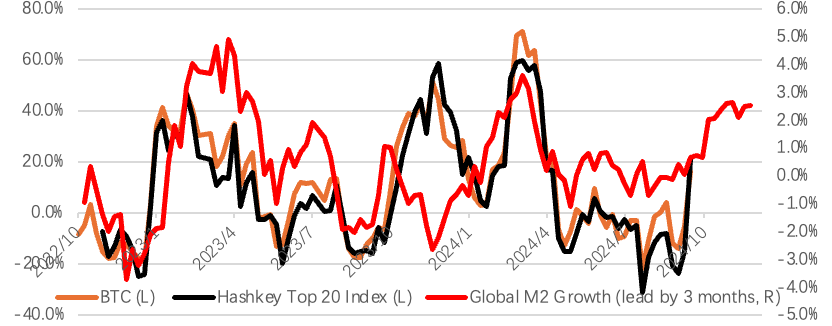
Global liquidity tends to lead the crypto market by approximately three months. We plotted the 8-week changes in BTC and the Hashkey Top 20 Index (as a proxy for altcoins) against the global money supply. Notably, the global liquidity index has been trending upward over the past several months.
Figure 13. Global M2 vs BTC vs Hashkey Top 20 index 8 weeks changes
Source: Bloomberg, BGeometrics
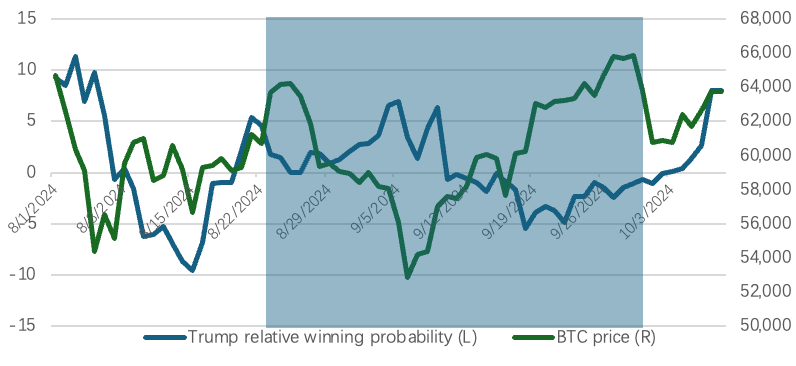
The upcoming U.S. election is a critical external variable for the crypto market in the next 30 days. The Bitcoin volatility term structure shows a clear kink point around the November 8 expiration, indicating increased market anticipation. The outcome of the election, along with control of both chambers of Congress, will shape future U.S. economic policies, impacting crypto regulation and investor confidence.
Figure 14. Trump winning probability vs BTC price
Source: Polymarket
Polymarket data from September indicates a divergence between Trump’s perceived election chances and Bitcoin’s price, suggesting the crypto market has already priced in some of the election’s risk. Historically, once the short-term uncertainty of elections subsides, the crypto market tends to experience significant rallies.
We estimate that Bitcoin remains in the mid-phase of a three-year bull cycle. Improving liquidity and the resolution of U.S. election uncertainties are expected to drive further market gains, potentially leading to new all-time highs (ATH) in the next 3–6 months.
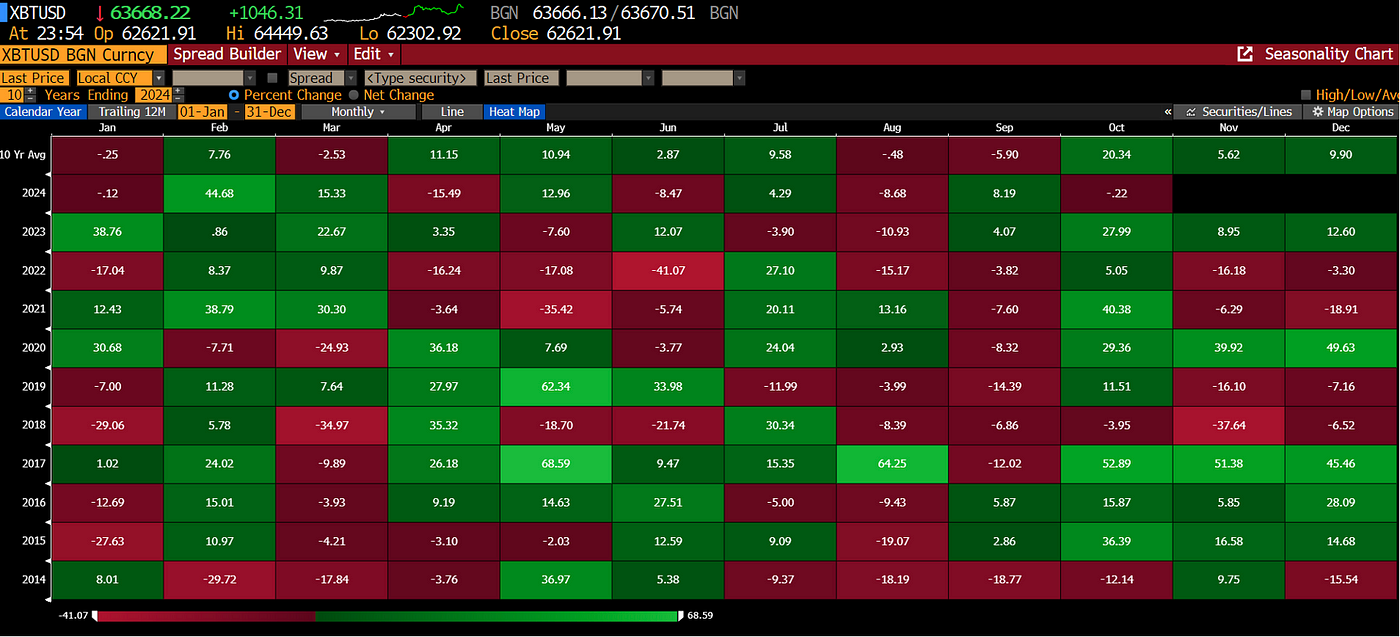
Additionally, Bitcoin has historically delivered strong Q4 returns, averaging 40% over the past decade. These factors, combined with favourable macroeconomic conditions, suggest that the bull market may continue its upward trajectory.
Figure 15. BTC monthly seasonality over the last 10 years
Source: Bloomberg
We have observed that altcoins tend to demonstrate high beta characteristics during the three months preceding Bitcoin’s new all-time highs. In four instances since 2016, when Bitcoin achieved new cyclical highs, the altcoin index outperformed Bitcoin in the three months leading up to these peaks, with the sole exception occurring in Q2 2016.
The current derivatives market has priced in a U.S. terminal rate of slightly over 3% for this easing cycle. As U.S. monetary easing extends into next year, we believe major altcoins with relatively high staking yields, such as ETH and SOL, are likely to benefit. Additionally, staking protocols (e.g., STETH) and delta-neutral DeFi protocols (e.g., ENA) are expected to gain from increased yield-seeking behavior in a lower interest rate environment.
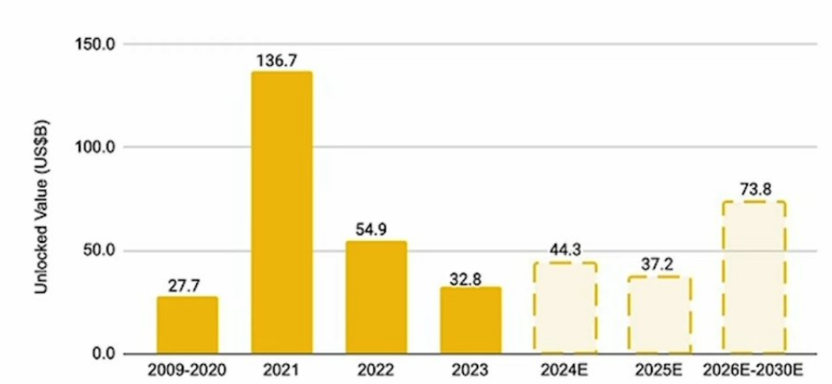
However, risks remain for altcoins in this cycle. With more projects launching with low circulating supplies, a total of USD 155 billion will be unlocked over the next few years. Price action may decouple from Bitcoin as capital inflows struggle to absorb the growing supply. Therefore, identifying fundamentally and technically strong altcoin assets is more critical than ever.
Figure 16. performance of BTC and altcoin 3 months prior BTC cycle high
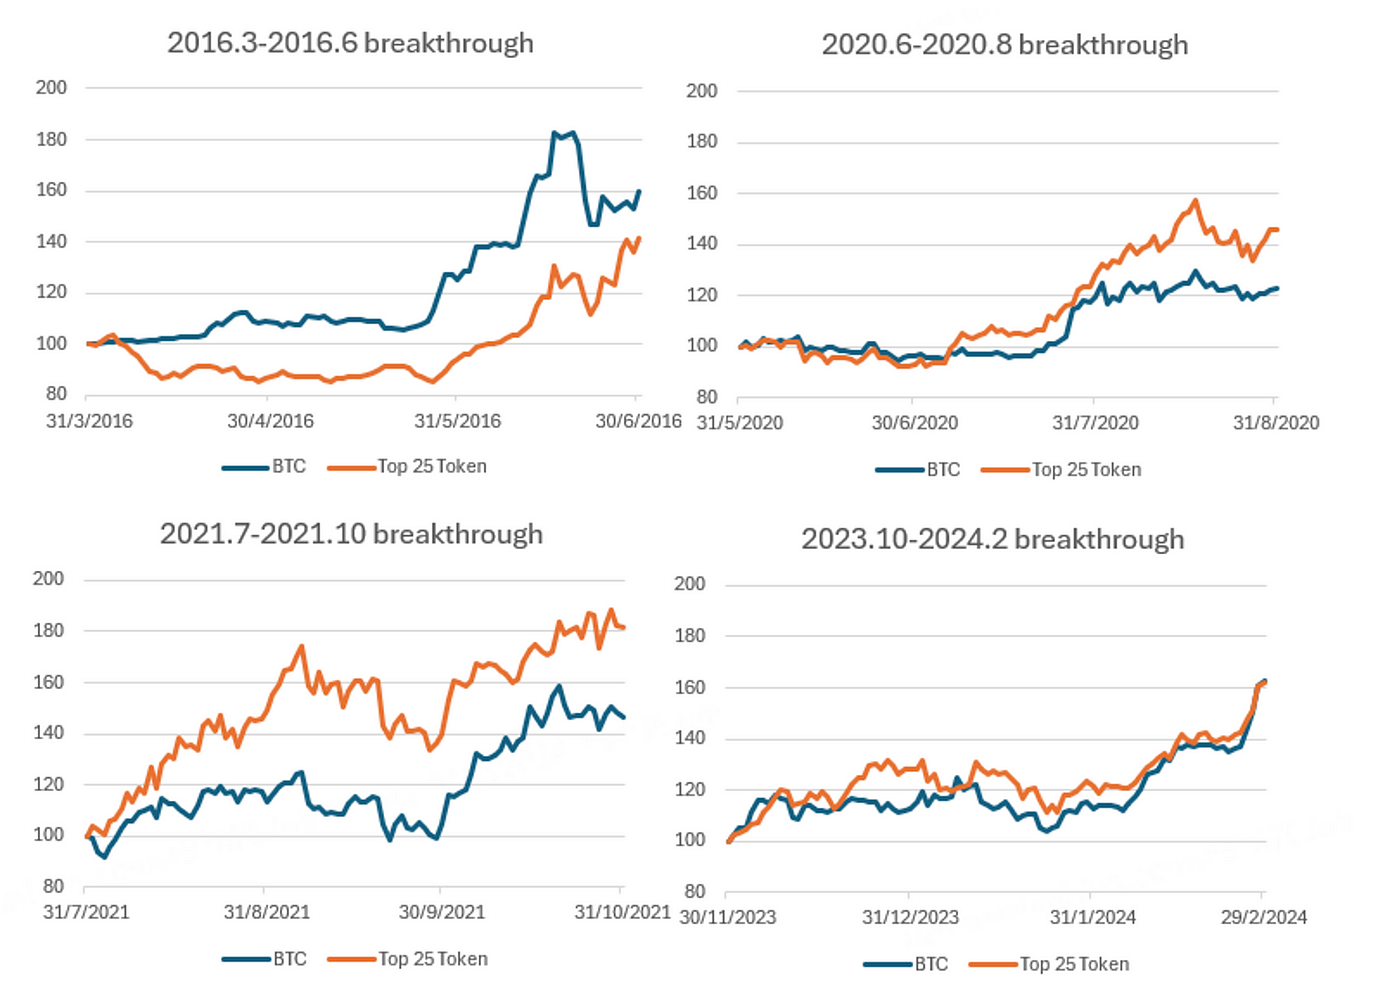
Note: we use MarketVector Digital Asset 25 Index due to its extended time series.
Figure 17. Token unlock value over next few years
Source: token unlock, Binance.
Timing: When and How to Navigate the Altcoin Landscape
3.1 Bitcoin Dominance
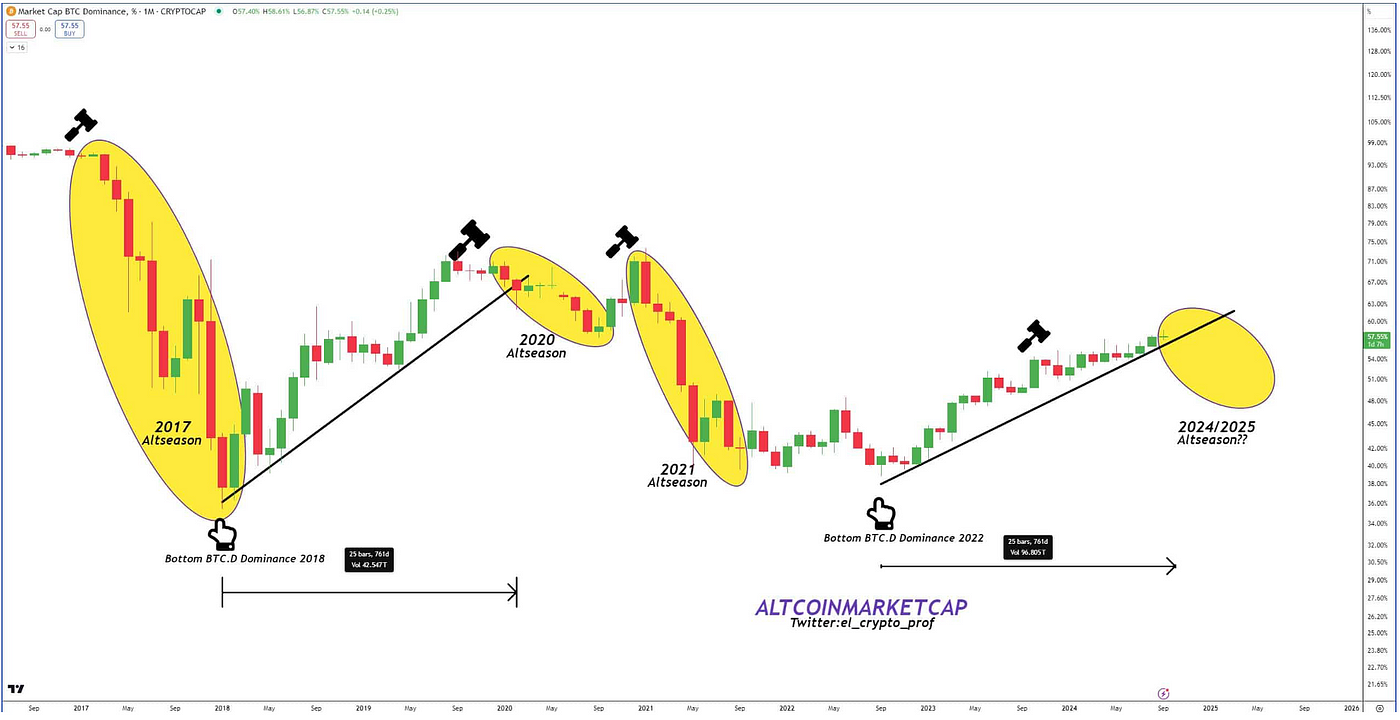
Historically, altcoins perform well after Bitcoin dominance (BTC.D) peaks. As Bitcoin captures market share early in a cycle, capital often shifts to altcoins once BTC dominance fades. This cycle benefits altcoins as investors seek higher risk, higher reward assets.
Figure 18. BTC dominance
Source: amccrypto
Let’s take a look back at several past Altcoin seasons in history:
2013–2014 Alt Season
Start Date: November 2013
End Date: January 2014
Bitcoin Dominance:
November 2013: ~95%
January 2014: ~85%
Catalyst: The launch of several new cryptocurrencies following Bitcoin’s initial success.
Key Events:
Introduction of Litecoin (LTC), Ripple (XRP), and Dogecoin (DOGE).
Bitcoin’s price surge to over $1,000 in late 2013, followed by a correction.
2017–2018 Alt Season
Start Date: December 2017
End Date: January 2018
Bitcoin Dominance:
December 2017: ~62%
January 2018: ~33%
Catalyst: The ICO (Initial Coin Offering) boom.
Key Events:
Ethereum (ETH) enabled the creation of ERC-20 tokens, facilitating numerous ICOs.
Massive influx of retail investors driven by media coverage and FOMO (Fear of Missing Out).
Bitcoin reached nearly $20,000 in December 2017.
2020–2021 Alt Season
Start Date: December 2020
End Date: April 2021
Bitcoin Dominance:
December 2020: ~70%
April 2021: ~40%
Catalyst: DeFi (Decentralized Finance) and NFT (Non-Fungible Token) booms.
Key Events:
Growth of DeFi platforms like Uniswap (UNI), Aave (AAVE), and Compound (COMP).
Surge in NFT popularity with projects like CryptoPunks and Bored Ape Yacht Club.
Institutional interest in cryptocurrencies, including investments from companies like Tesla and MicroStrategy.
From a static perspective, BTC dominance (BTC.D) likely needs to reach 62%-70% for altcoin season to begin. Currently, BTC.D is around 57%, meaning Bitcoin’s market capitalization would need to grow by approximately $280 billion based on the 62%-70% range.
This implies Bitcoin’s price would need to exceed $76,000. For a 70% BTC.D, the price would have to reach $108,000, with an average estimate of around $92,000. In an optimistic scenario, altcoin season is more probable when Bitcoin’s price surpasses $80,000.
Another factor is the correlation between Bitcoin’s price surge and ETFs. While this is generally seen as positive, if crypto-native funds drive the rally, capital may rotate from Bitcoin to altcoins. However, when ETFs lead the market, funds are less likely to shift into altcoins because mainstream investors typically lack direct access to them. Instead, capital is more likely to flow into other crypto-related stocks, which belong to two different worlds.
3.2 Risk appetite — not there yet
Another critical factor is risk appetite. At present, there are two key risk preferences that must be addressed:
Investors prioritize profitability. Given that crypto institutions have generated minimal profit, there is an increasing reliance on Bitcoin.
Altcoin sectors are underperforming, with few notable projects.
To address these issues, Bitcoin needs to rise first. The current price level is insufficient, as losses in Altcoins necessitate Bitcoin’s returns to offset them. This is why Bitcoin prices above $80,000 are being anticipated.
Furthermore, emerging sectors such as ETH, SOL, RWA, AI, and DePIN must show strong performance. Fortunately, recent quantitative easing measures in the U.S. and China have somewhat bolstered risk appetite.
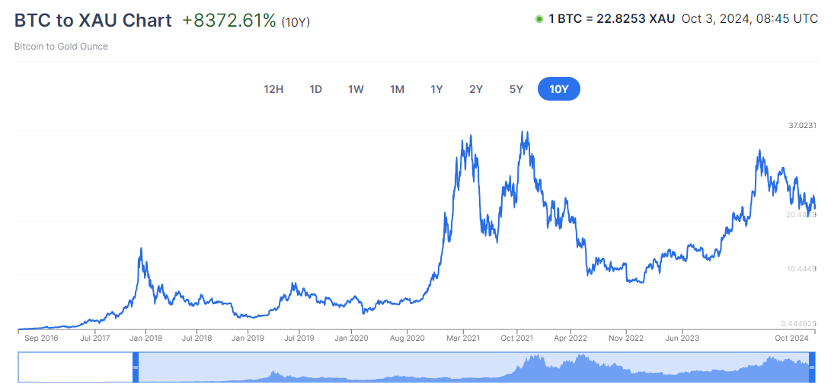
Risk appetite remains the most significant challenge, and we must wait for further improvement. Although Bitcoin outperformed in the first quarter, its momentum has since slowed. Despite its narrative as a store of value and digital currency, the BTC/Gold ratio has dropped from 33.6 in Q1 to 23 by early October, down from 20.5 at the beginning of the year.
As gold reaches new highs due to interest rate cuts and geopolitical tensions, Bitcoin has stagnated. This suggests that the broader market’s risk appetite for crypto remains low, and substantial capital has not yet flowed into Bitcoin as a digital gold alternative.
Figure 19. BTC vs gold ratio
Source: xe.com
Historically, the upward movement of the BTC/Gold ratio has generally coincided with Altcoin season. Consequently, a decline in risk appetite adversely affects the performance of Altcoins. It is, therefore, necessary to wait for the BTC/Gold ratio to enter an upward trend to signal more favourable conditions.
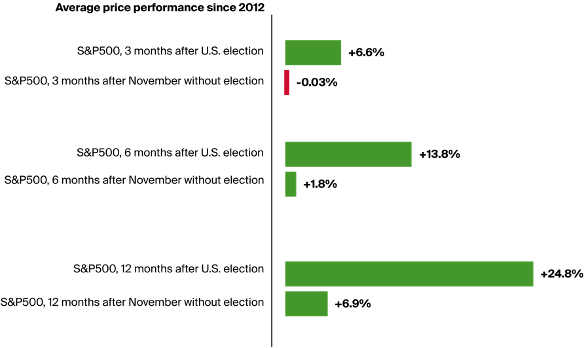
Since 2012, the performance of the S&P 500 in the years following U.S. presidential elections has significantly outpaced its performance in non-election years. On average, the S&P 500 has increased by approximately 6.6% in the three months following an election.
This growth rises to 13.8% over six months, and after one year, it averages an increase of 24.8%. By contrast, in non-election years, the S&P 500 typically sees a minimal decline of 0.03% after three months, with modest gains of 1.8% after six months and 6.9% after one year. Bitcoin’s price behaviour has also followed this trend, showing notable strength in the months and year following U.S. elections.
Figure 20. US equities and BTC performance during US election season

Source: Bitcoin Suisse
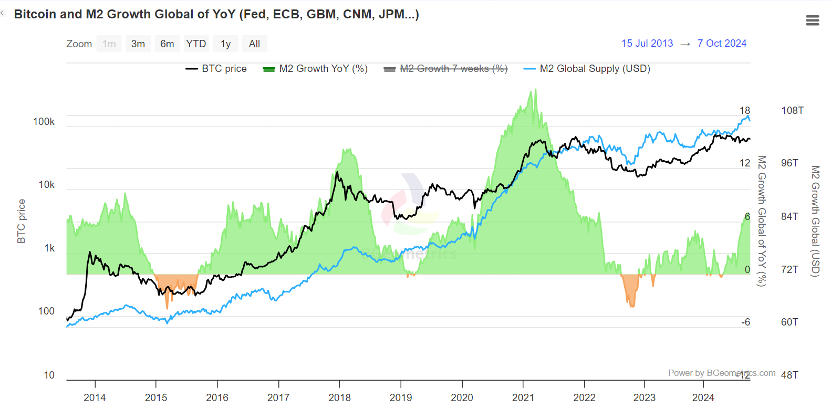
We should look closely on global liquidity:
Figure 21 Global liquidity vs BTC
Source: bgeometrics
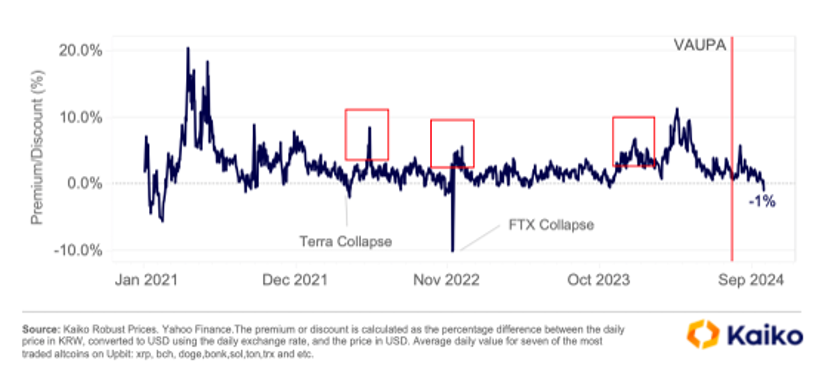
From the perspective of South Korean exchanges, the premium on Altcoins remains relatively low. According to Kaiko, the discount has reached its lowest point since the collapse of FTX, suggesting that South Korean traders may have realized profits following two months of declining prices. A resurgence of Altcoin season may only be feasible once the market transitions into a premium phase.
Figure 22. Altcoin Premium/Discount on Korea Markets
Source: Kaiko
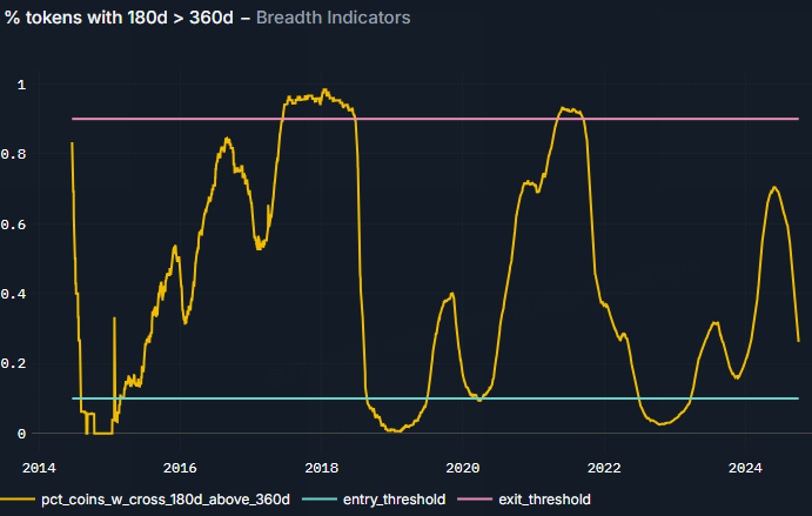
Several Altcoins have surpassed their 360-day moving average, a trend typically observed in the early stages of a bull market. This proportion is expected to increase further as bullish conditions return to the broader cryptocurrency market.
Figure 23. Altcoin breadth indicator
Source: Nansen
Thesis on altcoin and investment rational
4.1 Ethereum — Distressed play
As previously discussed, Ethereum’s underperformance can be attributed to several factors:
Increased Competition: Users are increasingly migrating to high-throughput blockchains that offer faster transaction speeds and greater scalability.
Lower Transaction Fees: The reliance on Layer 2 scaling solutions has significantly reduced transaction fees on the Ethereum network. While advantageous for users, this has had a negative impact on the network’s overall revenue generation.
Value Diversion: The growth of Layer 2 solutions, data availability services, alternative blockchains, and mechanisms such as staking and re-staking has diverted value away from Ethereum’s core network.
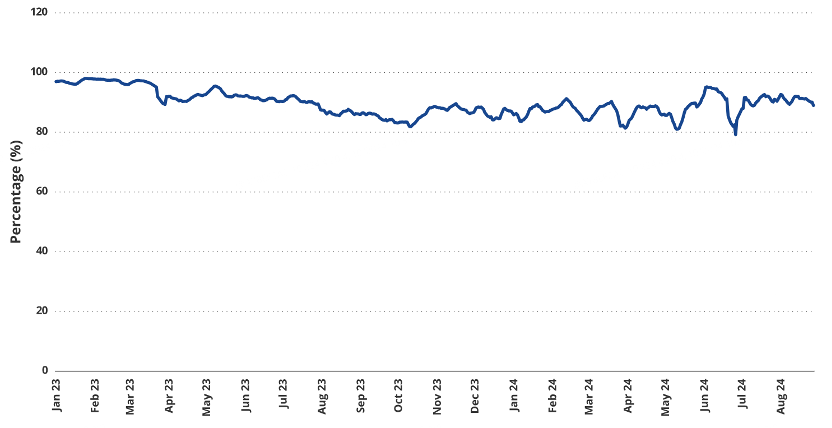
Figure 24. TLV for Ethereum since Jan 2023
Source: VanEck
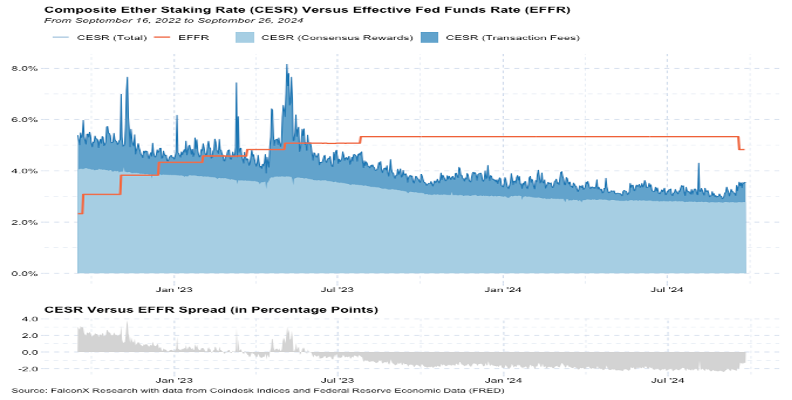
According to VanEck, ETH’s share of the Ethereum ecosystem’s token value has declined from 97% to 89% since January 2023. Following Ethereum’s transition to a proof-of-stake consensus mechanism in September 2022, the Comprehensive Ethereum Staking Rate (CESR) has been segmented into its consensus rewards and transaction fee components, alongside the Effective Federal Funds Rate (EFFR).
Since June 2023, the spread between the federal funds rate and the CESR has been negative. However, this gap is narrowing and is currently at its highest level since December 2023. This spread is expected to continue shrinking and may turn positive in the coming quarters, driven by anticipated Fed rate cuts and increased network usage.
Figure 25. Composite ether staking rate vs EFFR
Source: FalconX
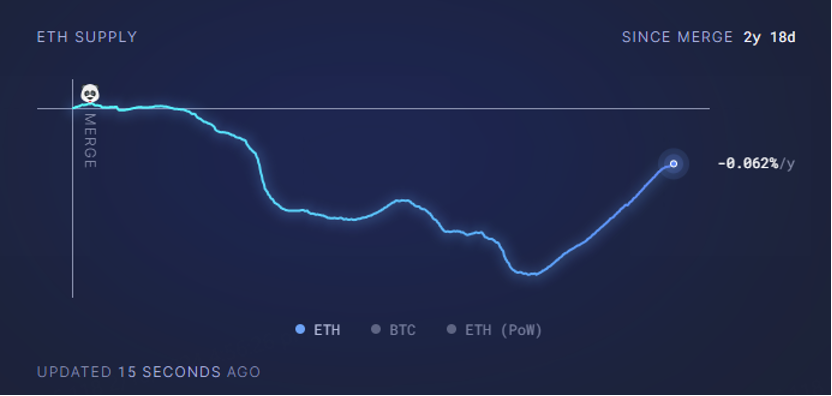
Based on the available data, it is anticipated that Ethereum’s performance will remain subdued until it enters a deflationary phase. The recent decrease in network usage has resulted in the issuance of approximately 3 million additional tokens, with around 1.5 million tokens returning to the supply levels observed at the time of the Merge.
Figure 26 ETH supply since the Merge in Sep 2022
Source: Ultrasound.money
Vitalik Buterin’s recent comments on “alignment”, stating that “the main challenge is to ensure that all projects collaboratively build an Ethereum ecosystem, rather than 138 incompatible territories.”
The concept of Ethereum consistency, which has recently been proposed by various ecosystems, emphasizes a positive-sum approach. As Vitalik Buterin noted, “The success of a project should benefit the entire Ethereum community (e.g., ETH holders, Ethereum users), even if they are not part of the project’s own ecosystem.” This initiative represents the start of a broader movement to strengthen Ethereum.
While numerous Layer 2 solutions have enhanced the speed and efficiency of Ethereum, they have also introduced fragmentation, reducing the cohesive usage experienced during the DeFi and NFT boom of 2020. Despite this, Ethereum is unlikely to become a low-margin operator due to its relatively low capital expenditures. Although competitors emerge in each cycle, this does not weaken Ethereum’s strong position.
Currently, the Ethereum community is developing metrics to measure “Ethereum alignment,” and it is anticipated that best practices will emerge from these efforts, further consolidating Ethereum’s ecosystem and ensuring long-term success.
4.2 Solid fundamental– Solana, Chainlink, Defi
We view Solana as a major fundamental play
· No MEV, No Layer 2: Solana operates without the need for Miner Extractable Value (MEV) and Layer 2 solutions. As a result, all value is concentrated within its Layer 1 tokens.
· Increased Activity: Rising usage on the network has led to higher transaction fees, signalling greater activity and adoption
Figure 27. Solana weekly revenue generated

Source: DefiLlama
Institutional adoption acceleration: Solana continues to build its narrative in the crypto space, particularly the meme community, cementing its position with a focus on high activity and institutional trust.
· Collaborations with Major Institutions: Over the past year, Solana has seen accelerated institutional adoption. This began with Visa, which leveraged Solana’s blockchain for stablecoin settlements.
· PayPal’s PYUSD Launch: In May 2024, PayPal launched its PYUSD stablecoin on Solana, integrating it into the PayPal ecosystem.
· Franklin Templeton: With $1.4 trillion in assets under management, Franklin Templeton announced plans to tokenize a mutual fund on the Solana blockchain.
· Citibank: Citibank is exploring Solana’s capabilities for cross-border financial transactions and the use of smart contracts.
Performance:
Solana-based meme coins have significantly outperformed their Ethereum counterparts, boasting an average return of 8,469% year-to-date compared to 962% for Ethereum-based meme coins according to coinmarketcap.
Notable meme coins on Solana include Dogwifhat (WIF), Bonk (BONK), and Popcat (POPCAT).
Community and Popularity:
Solana’s strong community engagement, combined with its low transaction costs, has greatly contributed to the success of its meme coins. Platforms such as Telegram and Discord are active with discussions, promotions, and collaborations surrounding these tokens.
Market Dynamics:
Solana has emerged as a preferred platform for launching new meme coins due to its high throughput and user-friendly tools. The network facilitates numerous daily token issuances, reflecting a dynamic and growing ecosystem.
Chainlink
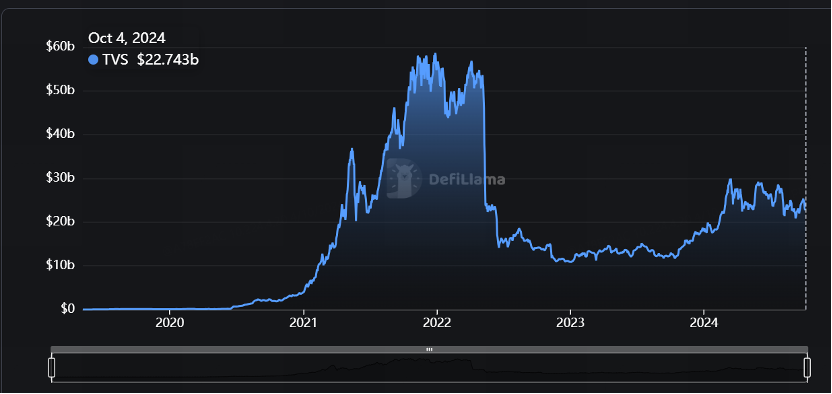
Chainlink has achieved significant progress, securing a Total Value Secured (TVS) of approximately $25 billion, which represents about half of its peak value.
At the same time, the price of LINK remains at just 25% of its all-time high, suggesting considerable underlying value. As the largest oracle provider, Chainlink is well-positioned to benefit from the growth of Real-World Asset (RWA) projects, which are rapidly emerging across the sector.
Figure 28. Total value secured (TVS) of Chainlink over time
Source: DefiLlama
• Chainlink’s Early Entry: Chainlink’s early entry into the market and institutional partnerships have cemented its position as the leading oracle network, giving it a competitive advantage over other networks.
• Business Model: Chainlink’s focus is on data support for decentralized applications (dApps), smart contracts, and real-world asset (RWA) services. This positions the network to benefit from the growing demand for these blockchain-based services.
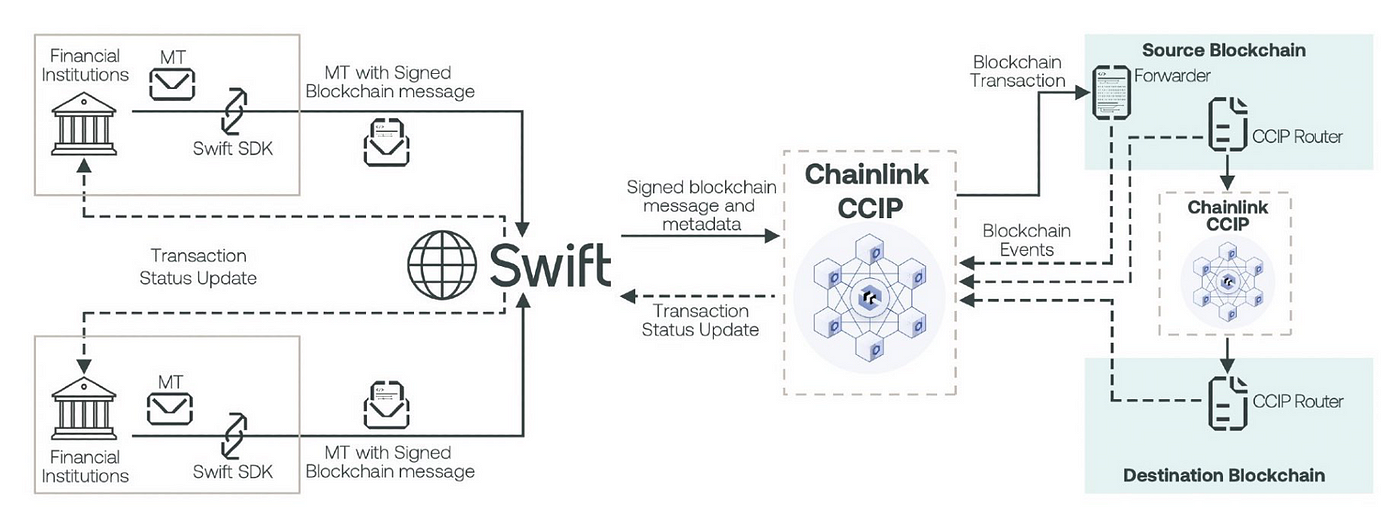
• Banking Integration: Banks and financial institutions are layering their existing infrastructure on top of blockchain technology, utilizing standards like SWIFT and ISO 20022 to speed up blockchain integration without replacing legacy systems.
Figure 29. Business model of Chainlink on Swift
Source: Chainlink
DeFi
DeFi protocols have made breakthrough advancements, enabling scalability and providing clear use cases.
The Federal Reserve has entered a period of easing, significantly cutting interest rates to stimulate the economy. This has resulted in ample liquidity within the system and encouraged people to seek more emerging yield opportunities, as traditional risk-free rates are very low.
Many DeFi projects from the last cycle have gradually become foundational infrastructure and have crossed cycles, forming a “must-have” landscape
DeFi is beginning to expand into a multi-chain ecosystem, and the leading positions in the industry are becoming more secure, unaffected by competition between chains.
4.3 Narrative driven
AI, RWA, Depin, Meme
5. Institutional Interest
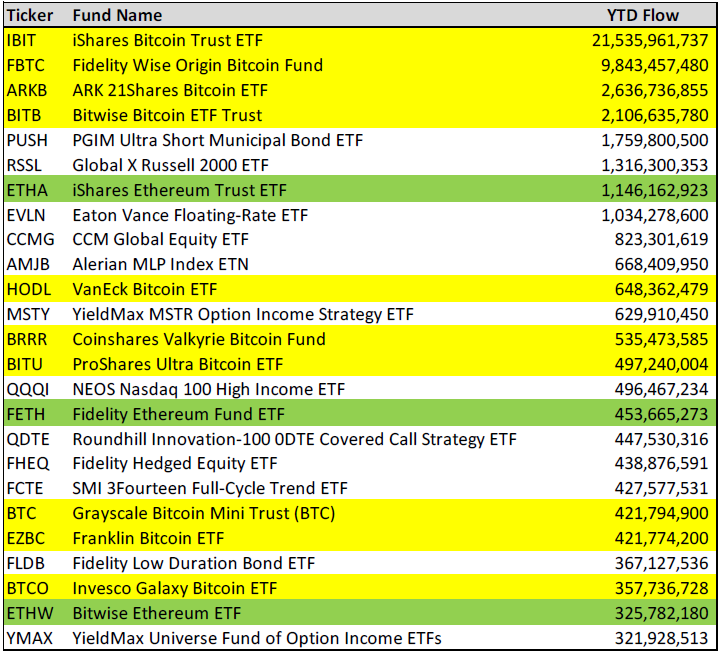
The ETF market has experienced significant growth in 2024, particularly in the area of cryptocurrency-related offerings. According to data from ETFstore:
Out of the 525 ETFs launched in 2024, 13 of the top 25 are directly linked to either Bitcoin or Ether.
This number increases to 14 when including the MSTR Option Strategy ETF, which incorporates cryptocurrency exposure.
The top four ETFs by performance are all spot Bitcoin ETFs.
Additionally, 5 of the top 7 crypto-related ETFs have been among the strongest performers in the market.
These trends highlight the growing institutional interest in cryptocurrency investments via ETFs, as Bitcoin and Ether continue to dominate the space.
Figure 30: Ranking of 2024 new setup ETF inflow
Source: ETFstore

